















Indicators · Momentum & oscillators
Stochastic
Shows where price closes within its recent high-low range on a 0–100 scale.
Origin: George Lane, 1950s
- Best suited to
- Ranging markets
- Responsiveness
- Leading
- Family
- Momentum & oscillators
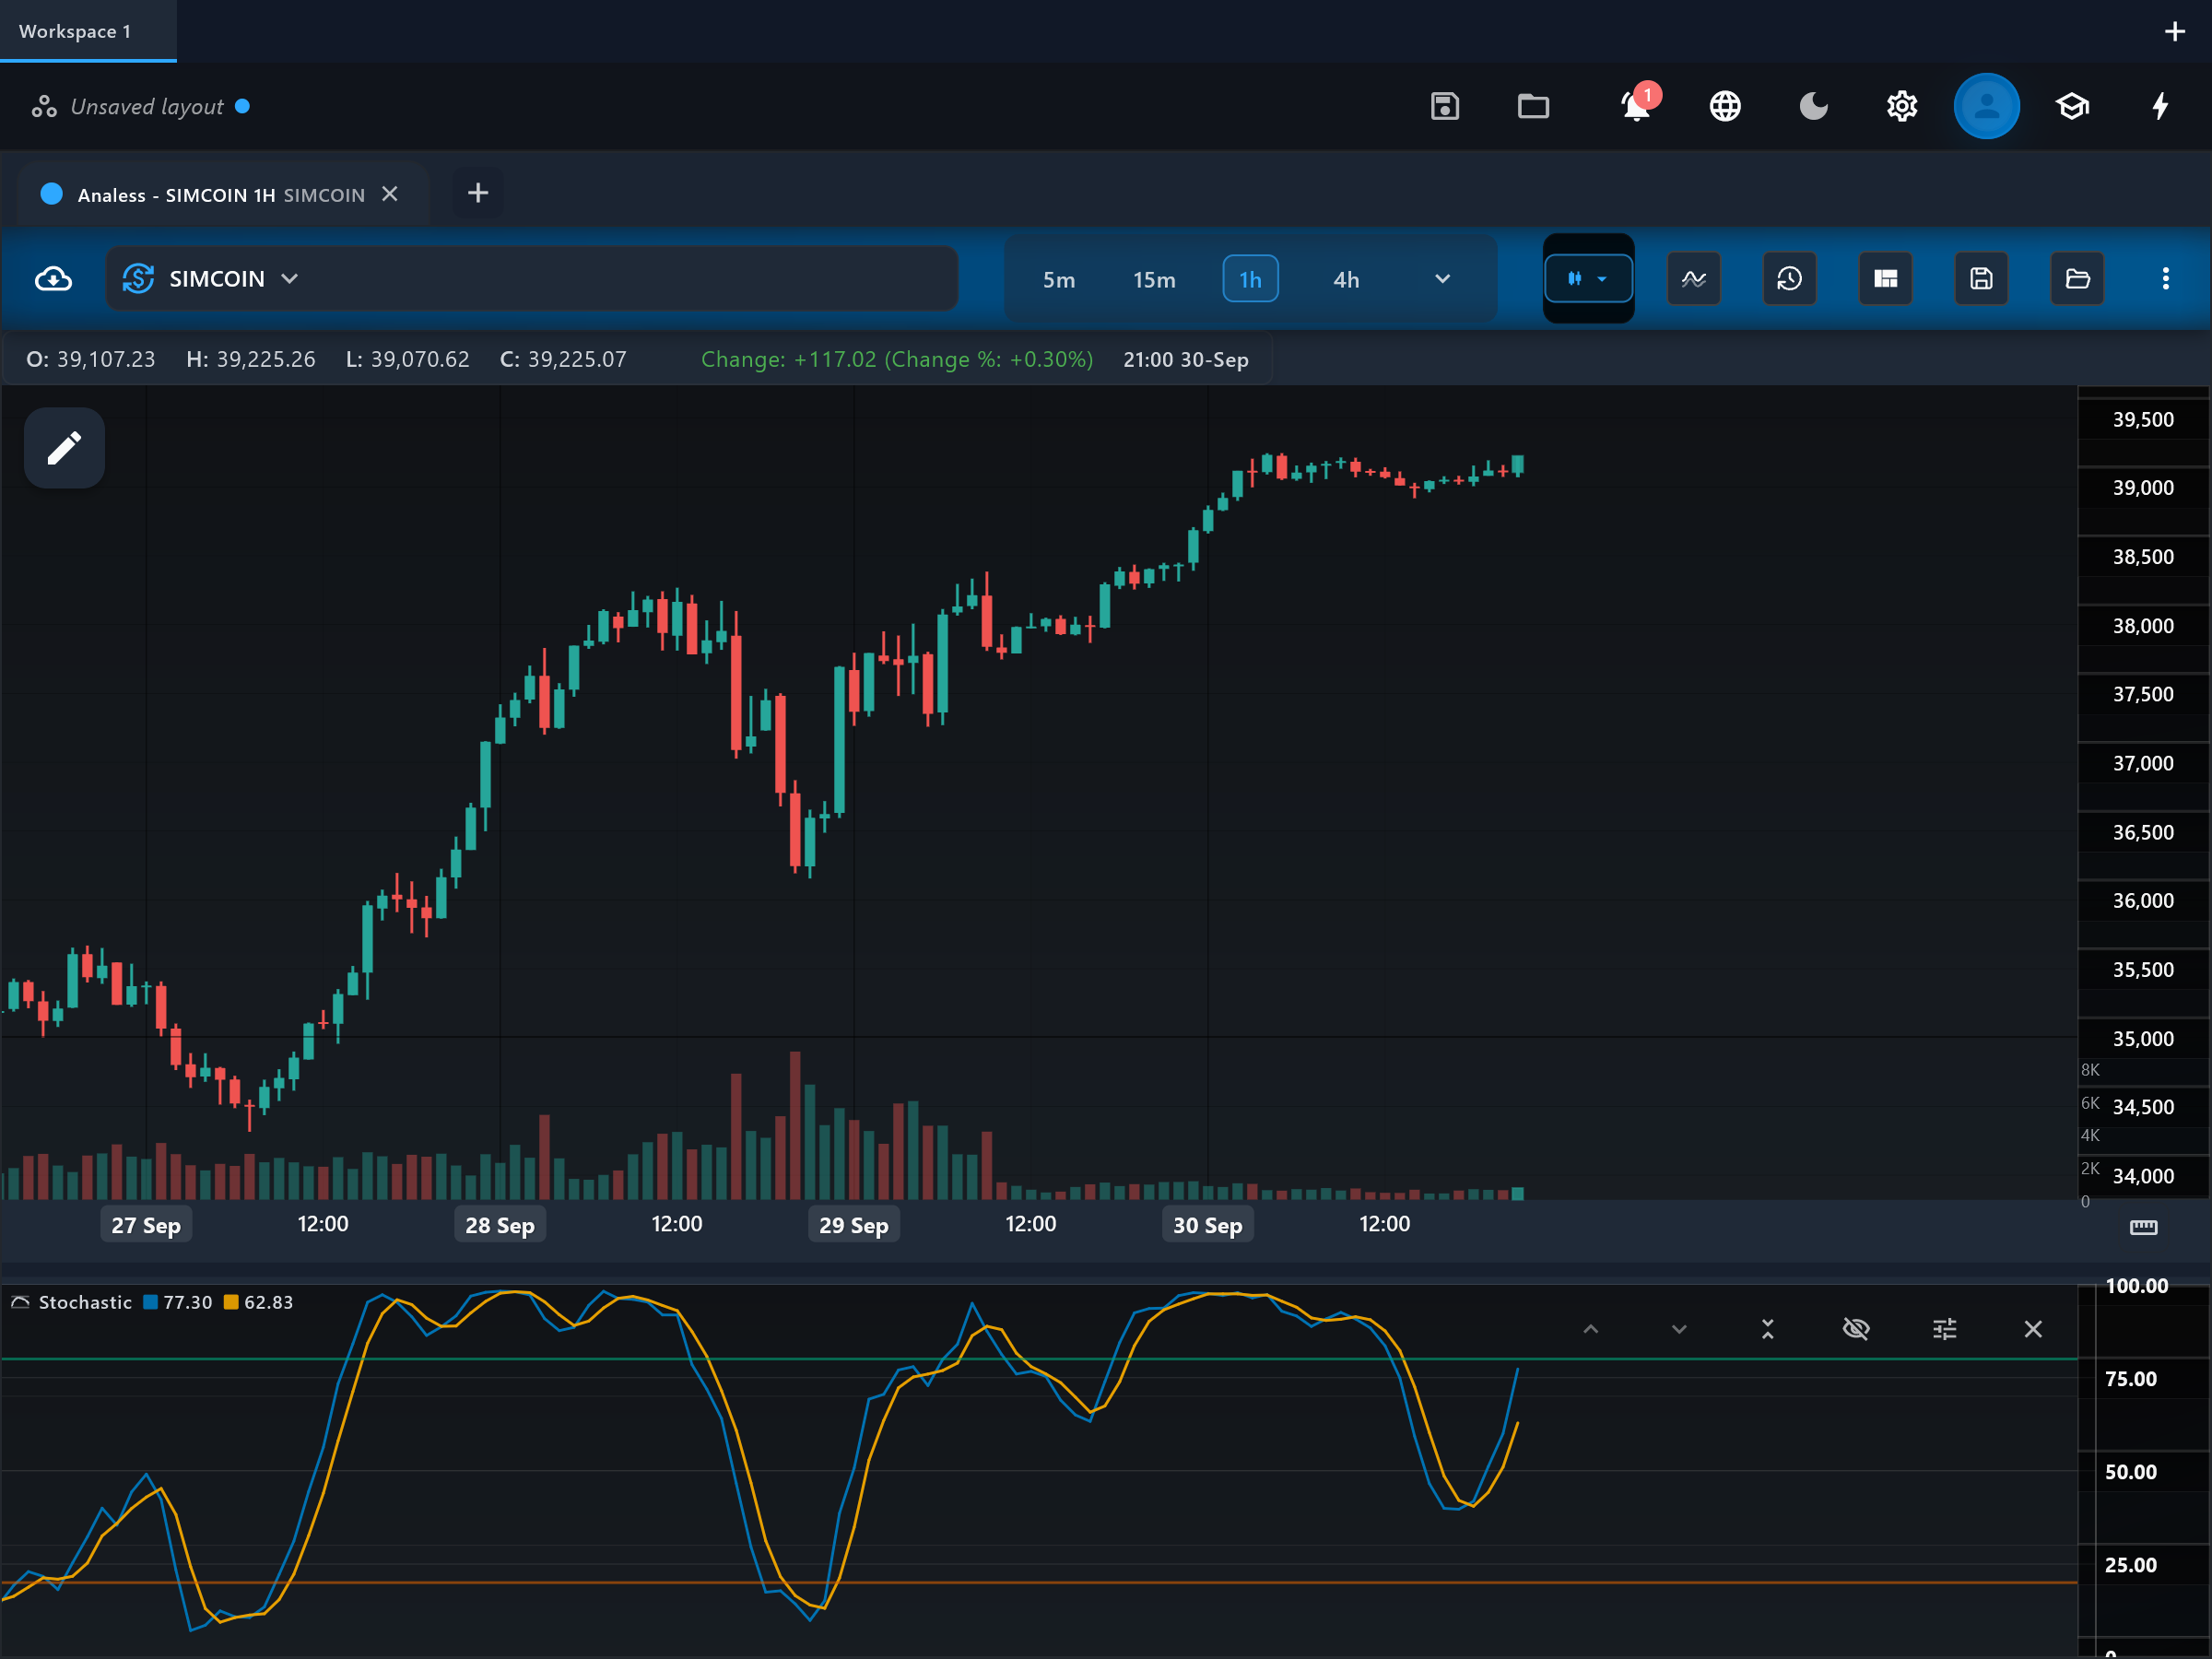
What it is
The Stochastic Oscillator shows where the current close sits within the recent high-low range, on a 0-100 scale. The idea is that in uptrends closes cluster near the top of the range and in downtrends near the bottom. This version is the "slow" stochastic, with an extra smoothing step.
How it is calculated
Raw %K = 100 x (close - lowest low) / (highest high - lowest low) over the %K period. This app then smooths raw %K with a simple moving average of length "slowing" to produce the plotted %K, and smooths that again with a simple moving average of length "%D period" to produce %D. The result is the classic slow stochastic: a fast line and its own moving average.
How to read it
The pane shows two lines — "k" (the smoothed %K) and "d" (its moving average) — between the "overbought" (default 80) and "oversold" (default 20) guide lines. The k line reacts first; the d line trails it. Readings above 80 mean closes are pinned near the top of the recent range, below 20 near the bottom. Crossings of k over or under d, especially inside the outer zones, are the classic things to watch.
What to look for
- Overbought / oversoldContext
Above the overbought line (80) closes sit near the top of the recent range; below the oversold line (20) near the bottom. In a trend the oscillator can stay in a zone for many bars.
- Signal-line crossUpside
k crossing above d, particularly from below the oversold zone, is the classic bullish stochastic cross.
- Signal-line crossDownside
k crossing below d, particularly from above the overbought zone, is the classic bearish stochastic cross.
- DivergenceContext
Divergence between price extremes and stochastic extremes (e.g. lower price low with a higher stochastic low) warns that range-position momentum is shifting.
When to use it
The stochastic is at its best in sideways, range-bound markets on any liquid instrument, where the 80/20 zones line up with the actual edges of the range. It is a poor standalone tool in strong trends: a bounded oscillator pegged at an extreme simply reflects trend persistence, and counter-trend crosses fire repeatedly and early. In trending conditions pair it with a trend filter and only take crosses in the trend direction.
Works well with
Settings explained
kPeriod- Default 14 — the lookback for the highest high and lowest low. Lower it (5-9) for a faster, twitchier oscillator; raise it (21+) for a slower one that tracks bigger swings.
slowing- Default 3 — the SMA applied to raw %K to make the "slow" stochastic. 1 gives the fast stochastic (no smoothing, more whipsaws); higher values smooth the k line further and delay crosses.
dPeriod- Default 3 — the SMA of the k line that forms d. Raising it makes d slower, producing fewer but later k/d crosses; lowering it tightens the two lines together.
overboughtLevel- Default 80 — the upper guide level drawn on the pane. Tighten it for choppier markets, loosen it for strong trends so fewer bars register as overbought.
oversoldLevel- Default 20 — the lower guide level drawn on the pane. Tighten it for choppier markets, loosen it for strong trends so fewer bars register as oversold.
Limitations and common mistakes
- Very whipsaw-prone in trends: it reaches an extreme early and stays there while price keeps running.
- k/d crosses fire frequently in quiet markets, producing many small false signals.
- The reading depends entirely on the chosen lookback window; a range break resets its meaning.
References
- Origin: George Lane, 1950s.
- Stochastic oscillator — Wikipedia (opens in a new tab)
This page explains how an indicator is calculated and read. It describes past data, not what price will do next, and it is not a recommendation to trade. Read the disclaimers.
Try it in Analess
Add Stochastic to any chart, adjust its settings, and open this explainer from the indicator itself.