















Indicators · Momentum & oscillators
Elliott Wave Oscillator
The gap between two averages, used to help count and confirm Elliott waves.
Origin: Tom Joseph, Advanced GET—the 5/34 oscillator, after Elliott
- Best suited to
- Trending markets
- Responsiveness
- Lagging
- Family
- Momentum & oscillators
What it is
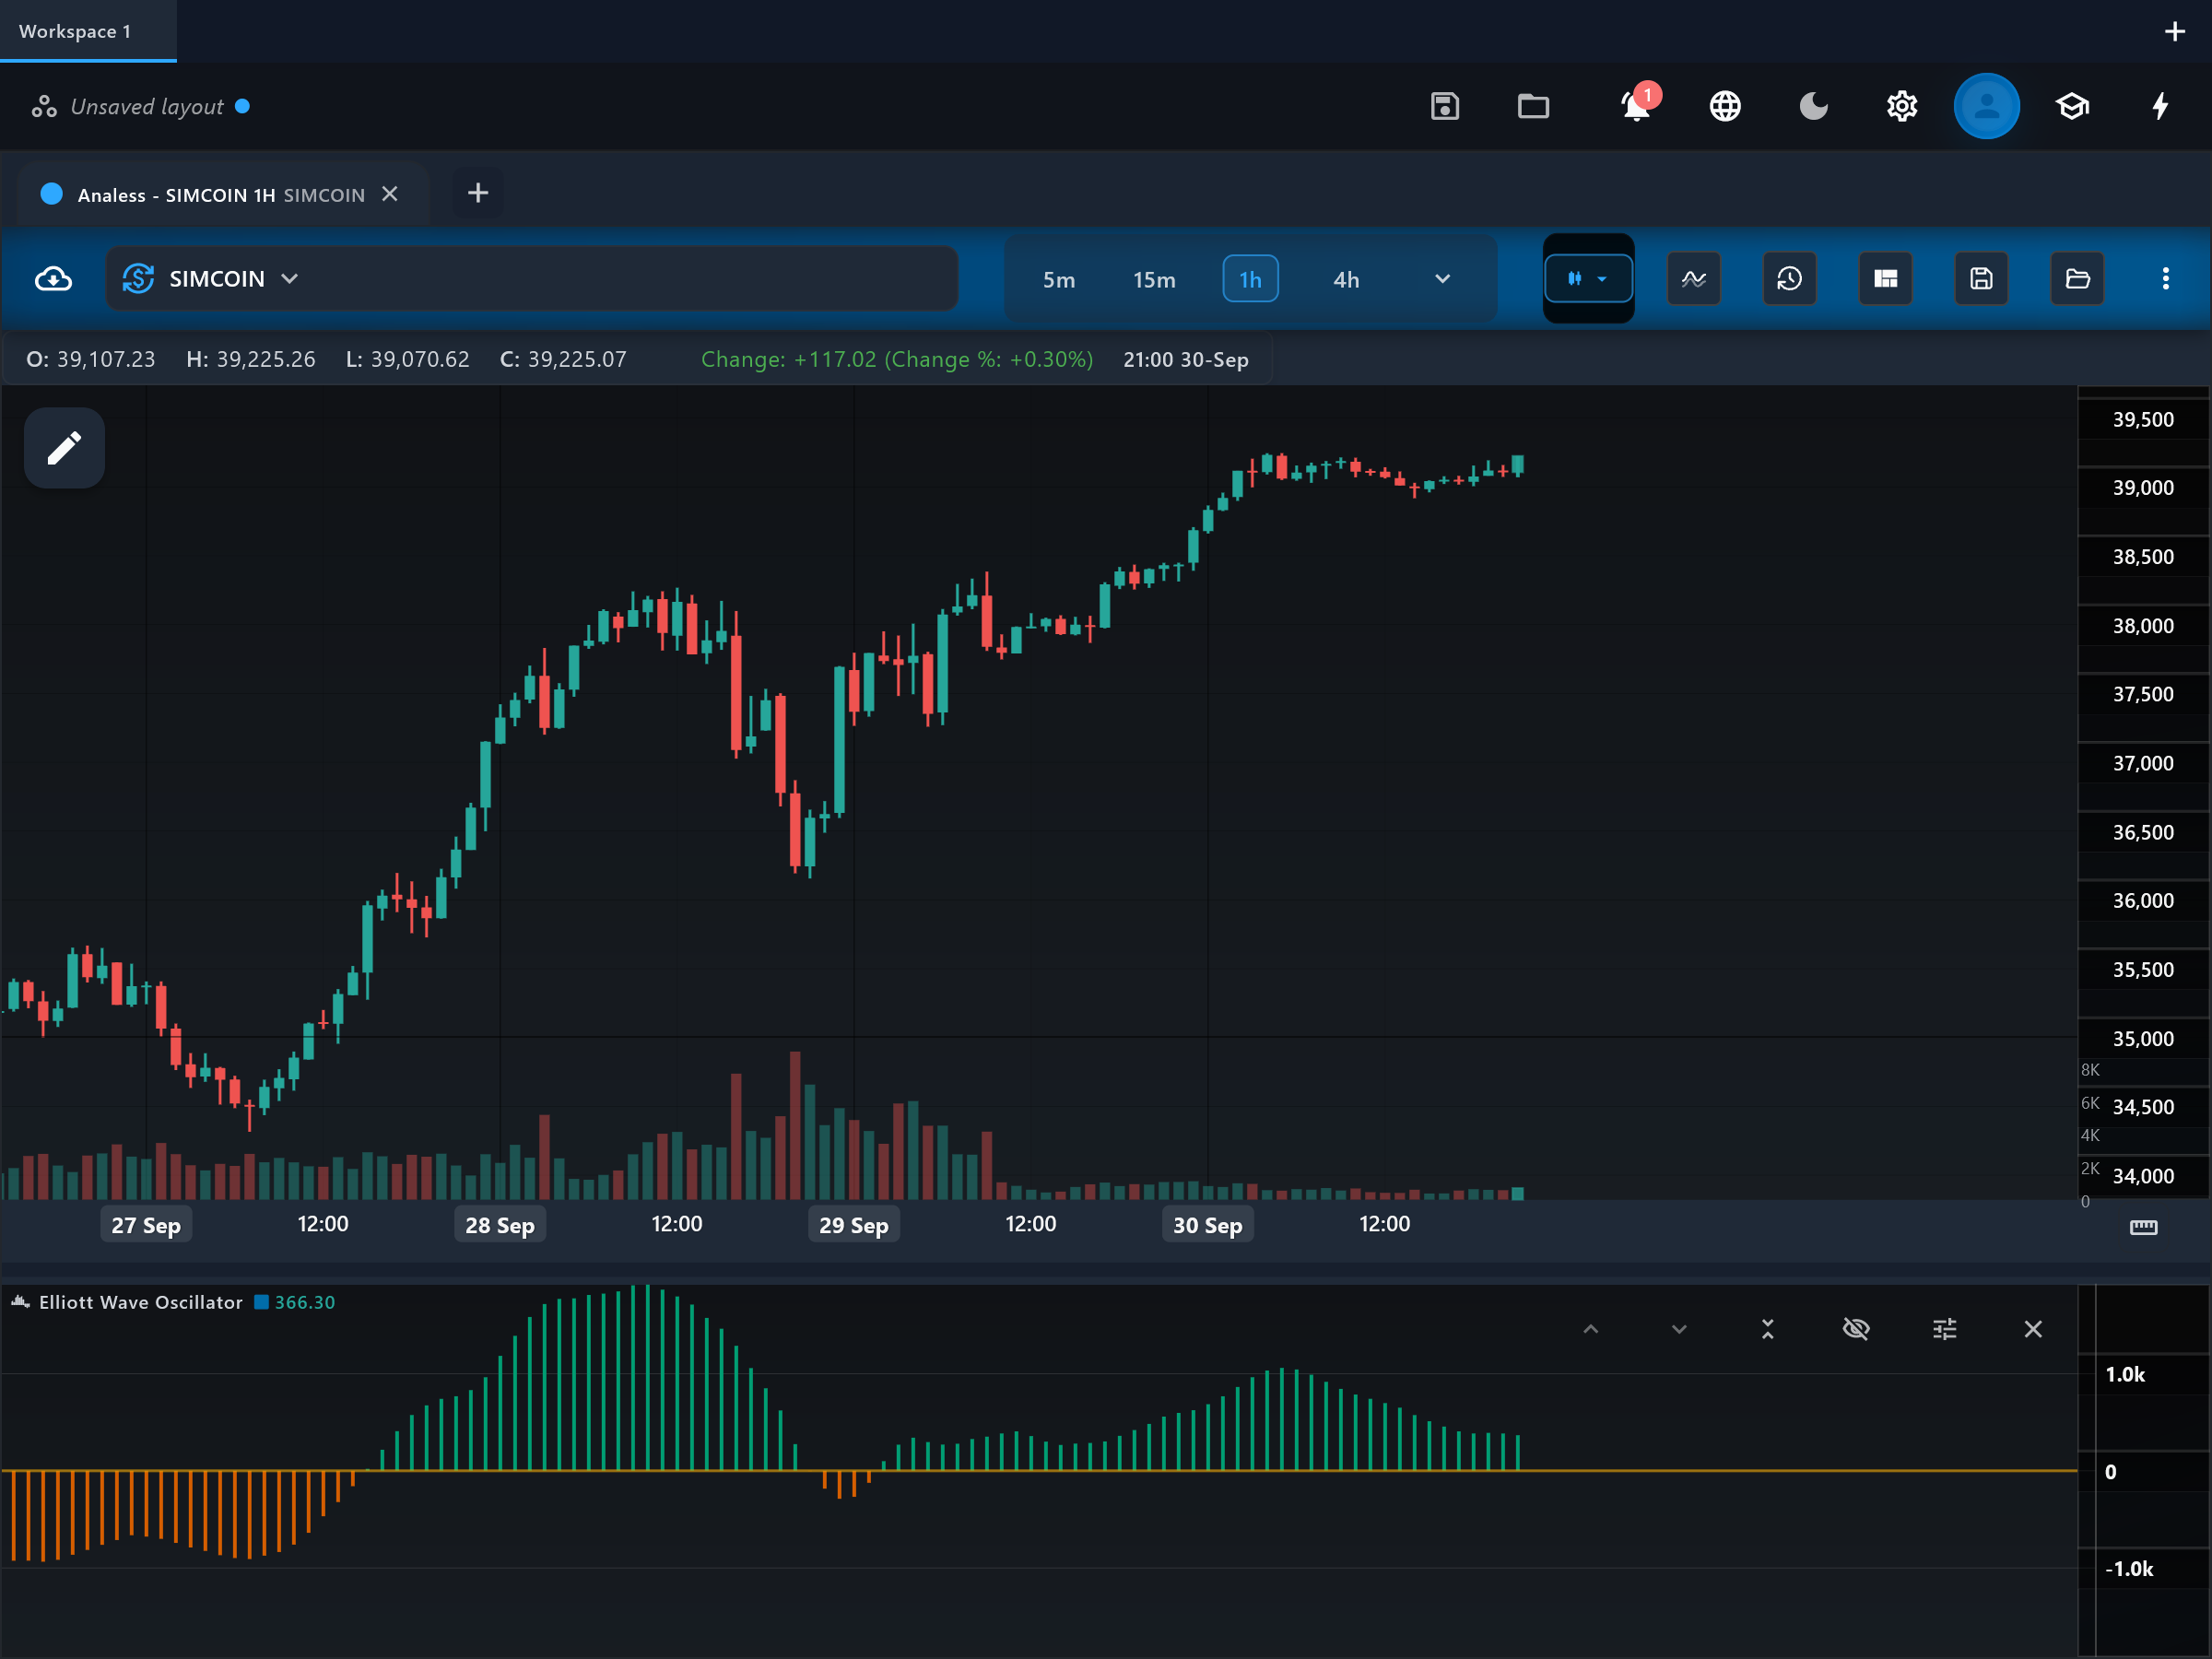
The Elliott Wave Oscillator (EWO) is a momentum histogram used by Elliott Wave practitioners to help label wave structure. It is built on the observation that the strongest momentum of an impulse sequence usually appears in wave 3, so the oscillator's largest extreme tends to mark wave 3 — and a weaker, diverging push afterwards suggests wave 5.
How it is calculated
EWO is the difference between a fast and a slow simple moving average of median price ((high + low) / 2) — 5 and 35 periods by default. The construction is nearly identical to the Awesome Oscillator (which uses 5/34); the 5/35 pairing is the convention popularized in Elliott-wave trading tools. The result is plotted as a histogram around zero.
How to read it
The "ewo" histogram swings around the "zero" line. In a five-wave advance, the tallest cluster of positive bars typically accompanies wave 3; the pullback toward (often through) zero maps to wave 4; and a renewed push to new price highs on visibly smaller bars — a divergence — is characteristic of wave 5. The same logic mirrors for declines. Practitioners often require the wave-4 retracement to bring the oscillator back by a large fraction of its wave-3 extreme before hunting the wave-5 setup.
What to look for
- DivergenceDownside
Price makes a higher high while the "ewo" histogram peaks lower than its previous extreme — the classic wave-5 divergence that precedes a corrective reversal.
- DivergenceUpside
Price makes a lower low on a shallower negative EWO extreme, suggesting a downside impulse is completing.
- Centre-line crossContext
A pullback of the histogram toward or through zero after a strong extreme often corresponds to a wave-4 correction within the impulse.
- Turning patternContext
The histogram's largest extreme of a sequence marks the likely wave-3 midpoint — a reference bar for projecting where the pattern completes.
When to use it
EWO is used wherever Elliott analysis is applied — indexes, FX, commodities, and crypto — and works best on swing timeframes (hourly to weekly) where impulse structures span enough bars for the 35-period baseline to be meaningful. It is a labelling aid, not a stand-alone system: its value comes from combining it with an actual wave count. In choppy, corrective, or news-driven markets without clear impulses, its extremes and divergences lose their intended meaning.
Works well with
Settings explained
fastPeriod- Length of the fast median-price SMA, default 5 — the convention in Elliott-wave tools. Shortening it exaggerates each sub-wave; lengthening it merges them.
slowPeriod- Length of the slow baseline SMA, default 35. The 35-bar window is chosen so a typical five-wave sequence fits within it; changing it re-tunes which degree of wave structure the oscillator highlights.
Limitations and common mistakes
- Its interpretive framework assumes an Elliott impulse is actually unfolding — outside that context it is just a fast/slow SMA spread.
- Wave labels are only certain in hindsight; the oscillator narrows the options but cannot remove the ambiguity of a live count.
- It is unbounded and instrument-relative, so extreme heights are comparable only within the same chart and degree.
References
- Origin: Tom Joseph, Advanced GET—the 5/34 oscillator, after Elliott.
- Elliott wave principle — Wikipedia (opens in a new tab)
This page explains how an indicator is calculated and read. It describes past data, not what price will do next, and it is not a recommendation to trade. Read the disclaimers.
Try it in Analess
Add Elliott Wave Oscillator to any chart, adjust its settings, and open this explainer from the indicator itself.