















Indicators · Trend
Vortex
Two lines capturing positive and negative trend movement to identify the start of a trend.
Origin: Etienne Botes and Douglas Siepman, 2010
- Best suited to
- Trending markets
- Responsiveness
- Lagging
- Family
- Trend
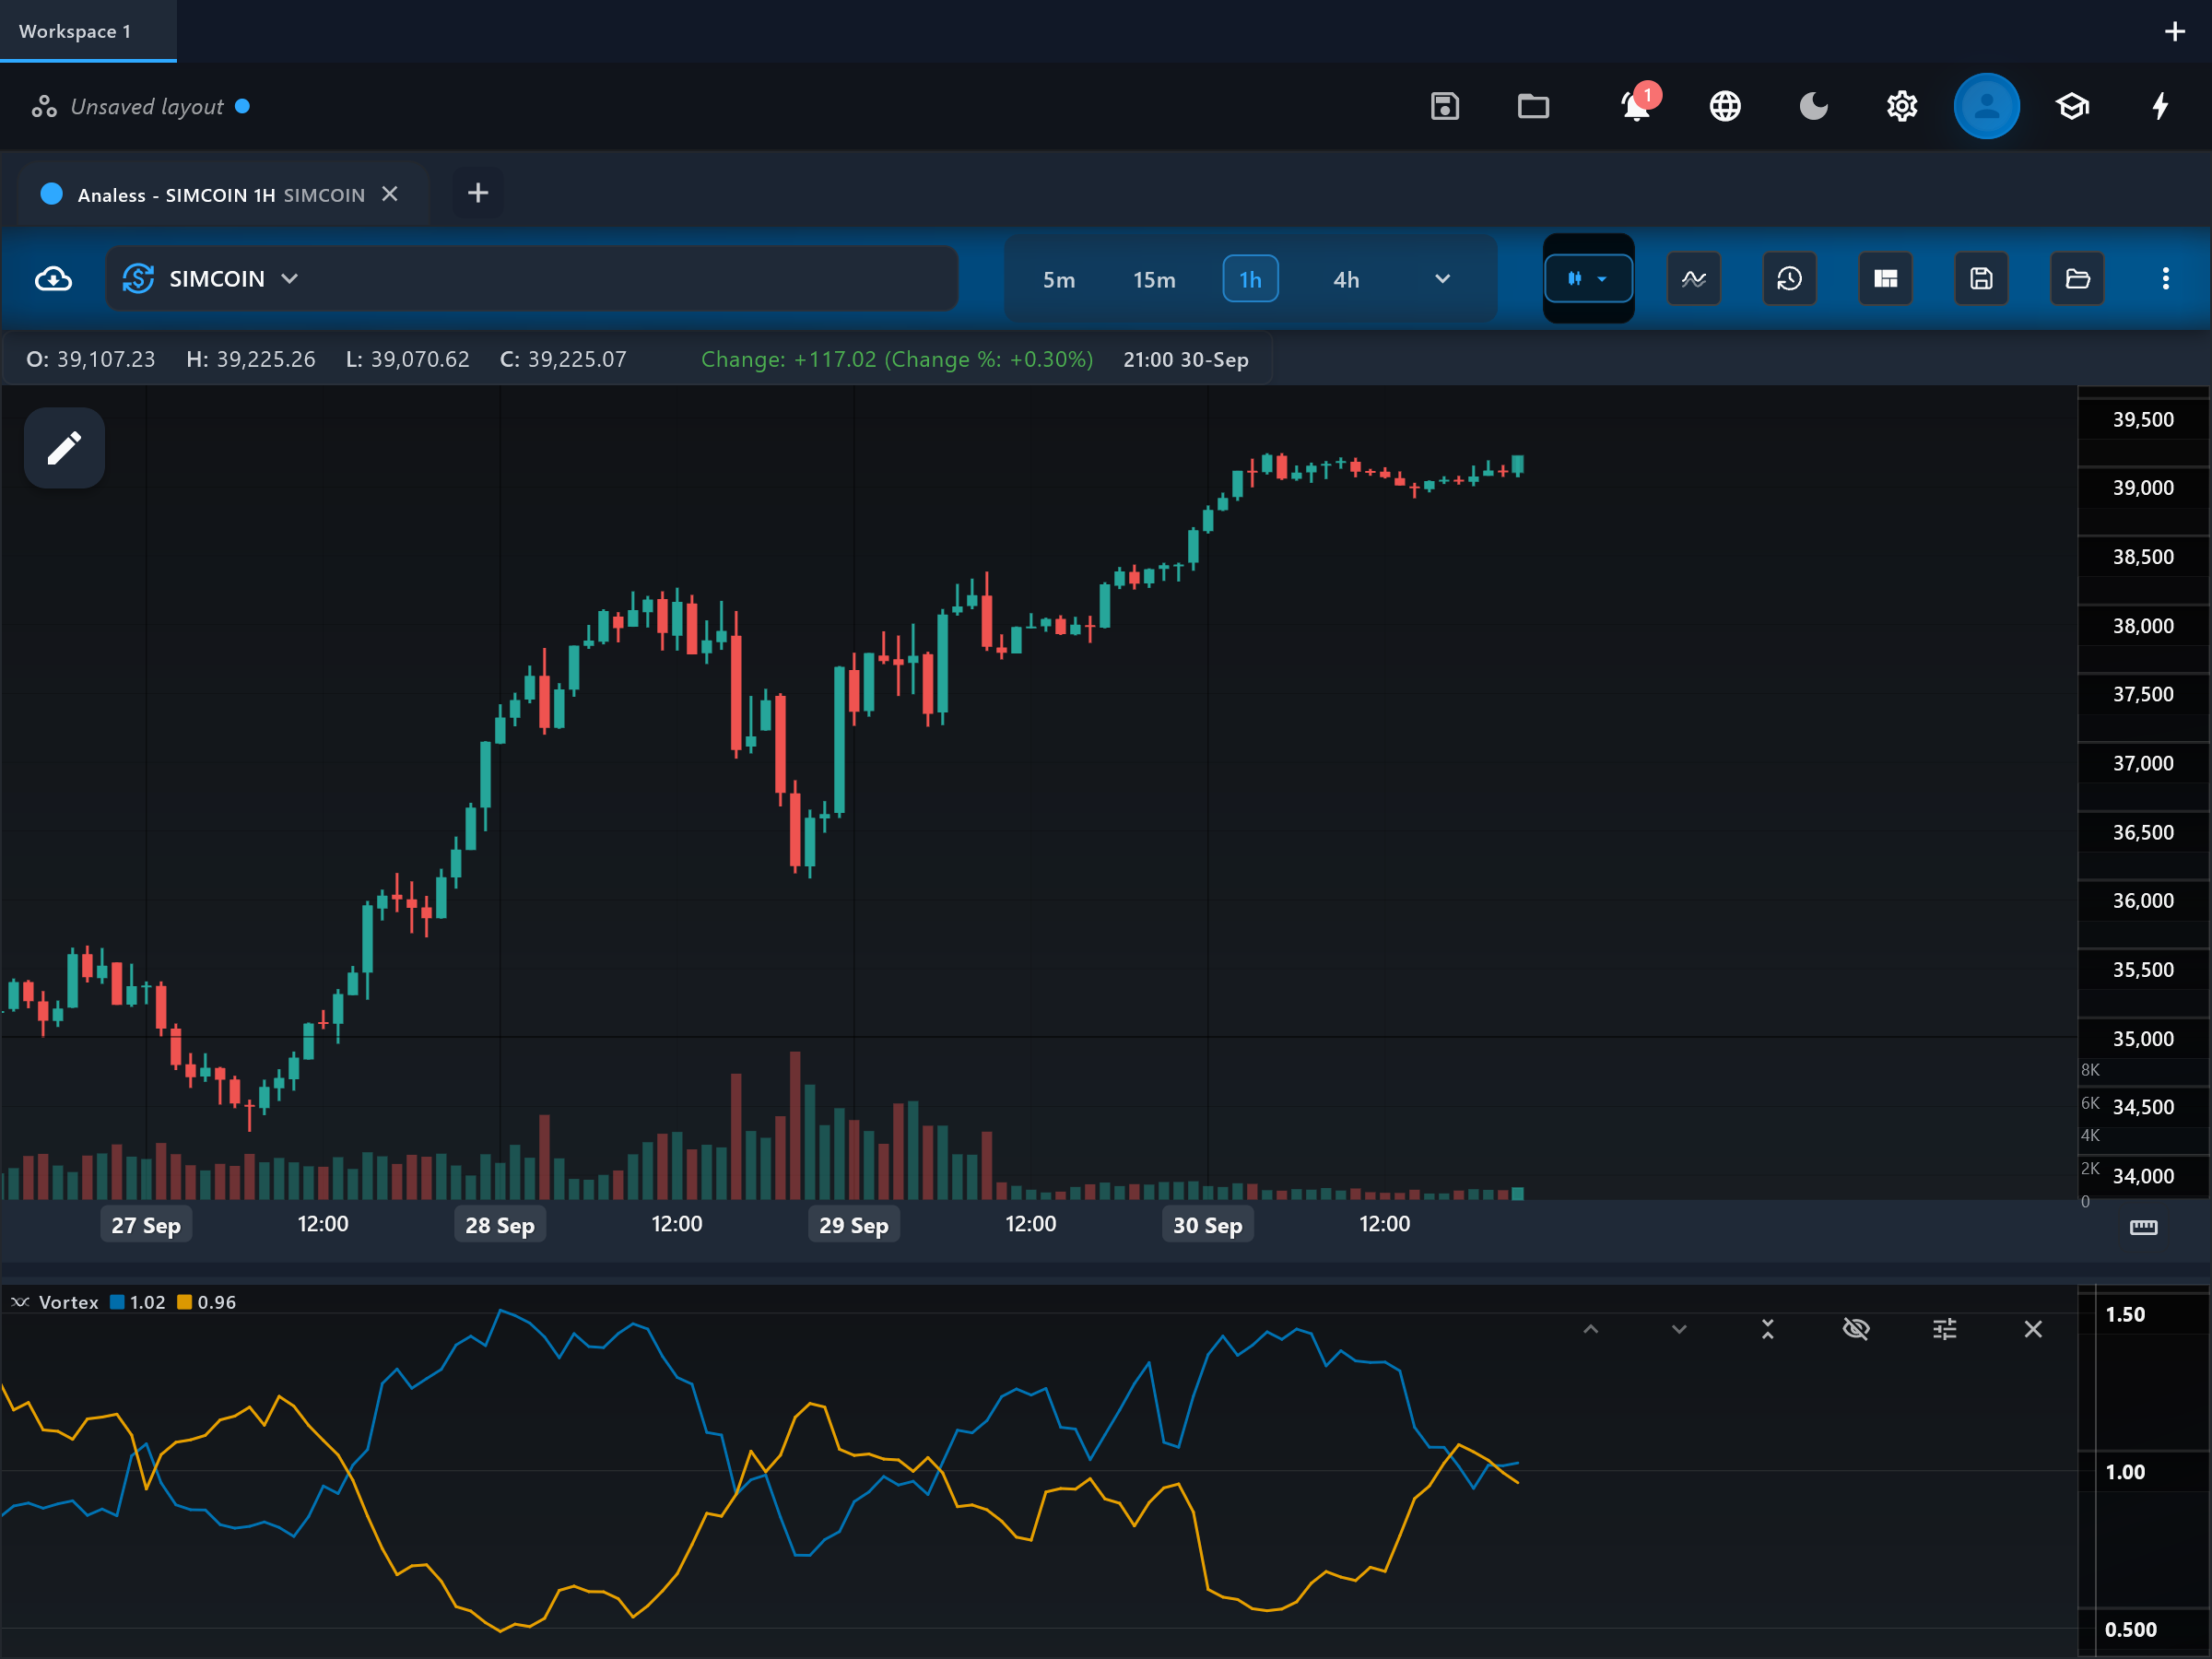
What it is
The Vortex Indicator tracks two intertwined lines, VI+ and VI-, inspired by the vortex-like rotation the authors saw in market flows. The line on top identifies the prevailing direction, and their crossings mark potential trend changes.
How it is calculated
Upward vortex movement (VM+) is the distance from this bar's high to the PREVIOUS bar's low; downward movement (VM-) is the distance from this bar's low to the previous bar's high - the wider these cross-bar spans, the stronger the rotation in that direction. Each is summed over the period and divided by the sum of true range over the same window, giving vi_plus and vi_minus, which oscillate around 1.0.
How to read it
The pane shows vi_plus and vi_minus weaving around the 1.0 level. vi_plus above vi_minus indicates upward price rotation is dominant; the reverse indicates downward dominance. The distance between the lines matters: a wide, sustained gap marks a strong trend, while lines braiding tightly around each other (and around 1.0) mark a directionless market. Crossings are the headline events, but they are most meaningful after the lines have been separated for a while.
What to look for
- Signal-line crossUpside
vi_plus crossing above vi_minus signals a potential shift to upward trend rotation.
- Signal-line crossDownside
vi_minus crossing above vi_plus signals a potential shift to downward rotation.
- ConfirmationContext
A widening gap between the lines after a cross confirms the new trend is gaining traction; a cross that immediately re-crosses is range noise.
- Trend filterContext
Both lines hugging 1.0 with frequent crossings flags a choppy market where trend entries are premature.
When to use it
Vortex was published for futures and works well on daily charts of trending commodities, indices and forex; crypto's long directional runs also suit it. Its authors suggested pairing it with a trend-strength or stop discipline rather than trading every cross. Avoid it in tight consolidations - by construction the two lines cross constantly there - and be careful on gap-prone stocks, since the cross-bar spans it measures are stretched by overnight gaps.
Works well with
Settings explained
period- Default 14. The window over which vortex movement and true range are summed. Shorter periods (e.g. 7) catch reversals earlier at the cost of many false crosses; longer periods (e.g. 21-30) keep you in trends longer but concede more ground at turns.
Limitations and common mistakes
- Raw crossovers whipsaw heavily in ranging markets - the indicator was designed for trending conditions.
- Because it sums over a window, it lags at sharp V-shaped reversals; the cross often prints several bars after the turn.
- Overnight gaps inflate the cross-bar distances, so readings on gap-heavy instruments are less comparable across days.
References
- Origin: Etienne Botes and Douglas Siepman, 2010.
- Vortex indicator — Wikipedia (opens in a new tab)
This page explains how an indicator is calculated and read. It describes past data, not what price will do next, and it is not a recommendation to trade. Read the disclaimers.
Try it in Analess
Add Vortex to any chart, adjust its settings, and open this explainer from the indicator itself.