















Indicators · Moving averages
Arnaud Legoux Moving Average (ALMA)
A Gaussian-weighted moving average designed to cut lag while staying smooth.
Origin: Arnaud Legoux and Dimitrios Kouzis-Loukas, 2009
- Best suited to
- Trending markets
- Responsiveness
- Lagging
- Family
- Moving averages
What it is
The Arnaud Legoux Moving Average (ALMA) is a Gaussian-weighted moving average that aims for an unusually good trade-off between smoothness and responsiveness. Its weighting window can be slid toward recent bars, which removes much of the lag of a comparable simple or exponential average.
How it is calculated
ALMA multiplies the last N prices by a bell-shaped (Gaussian) curve and sums the result. The offset parameter positions the peak of the bell within the window — the default 0.85 places it near the most recent bars — and sigma controls how wide the bell is (the app uses a width of period / sigma). A high offset favors responsiveness; a wider bell favors smoothness. The weights are normalized so they always sum to 1.
How to read it
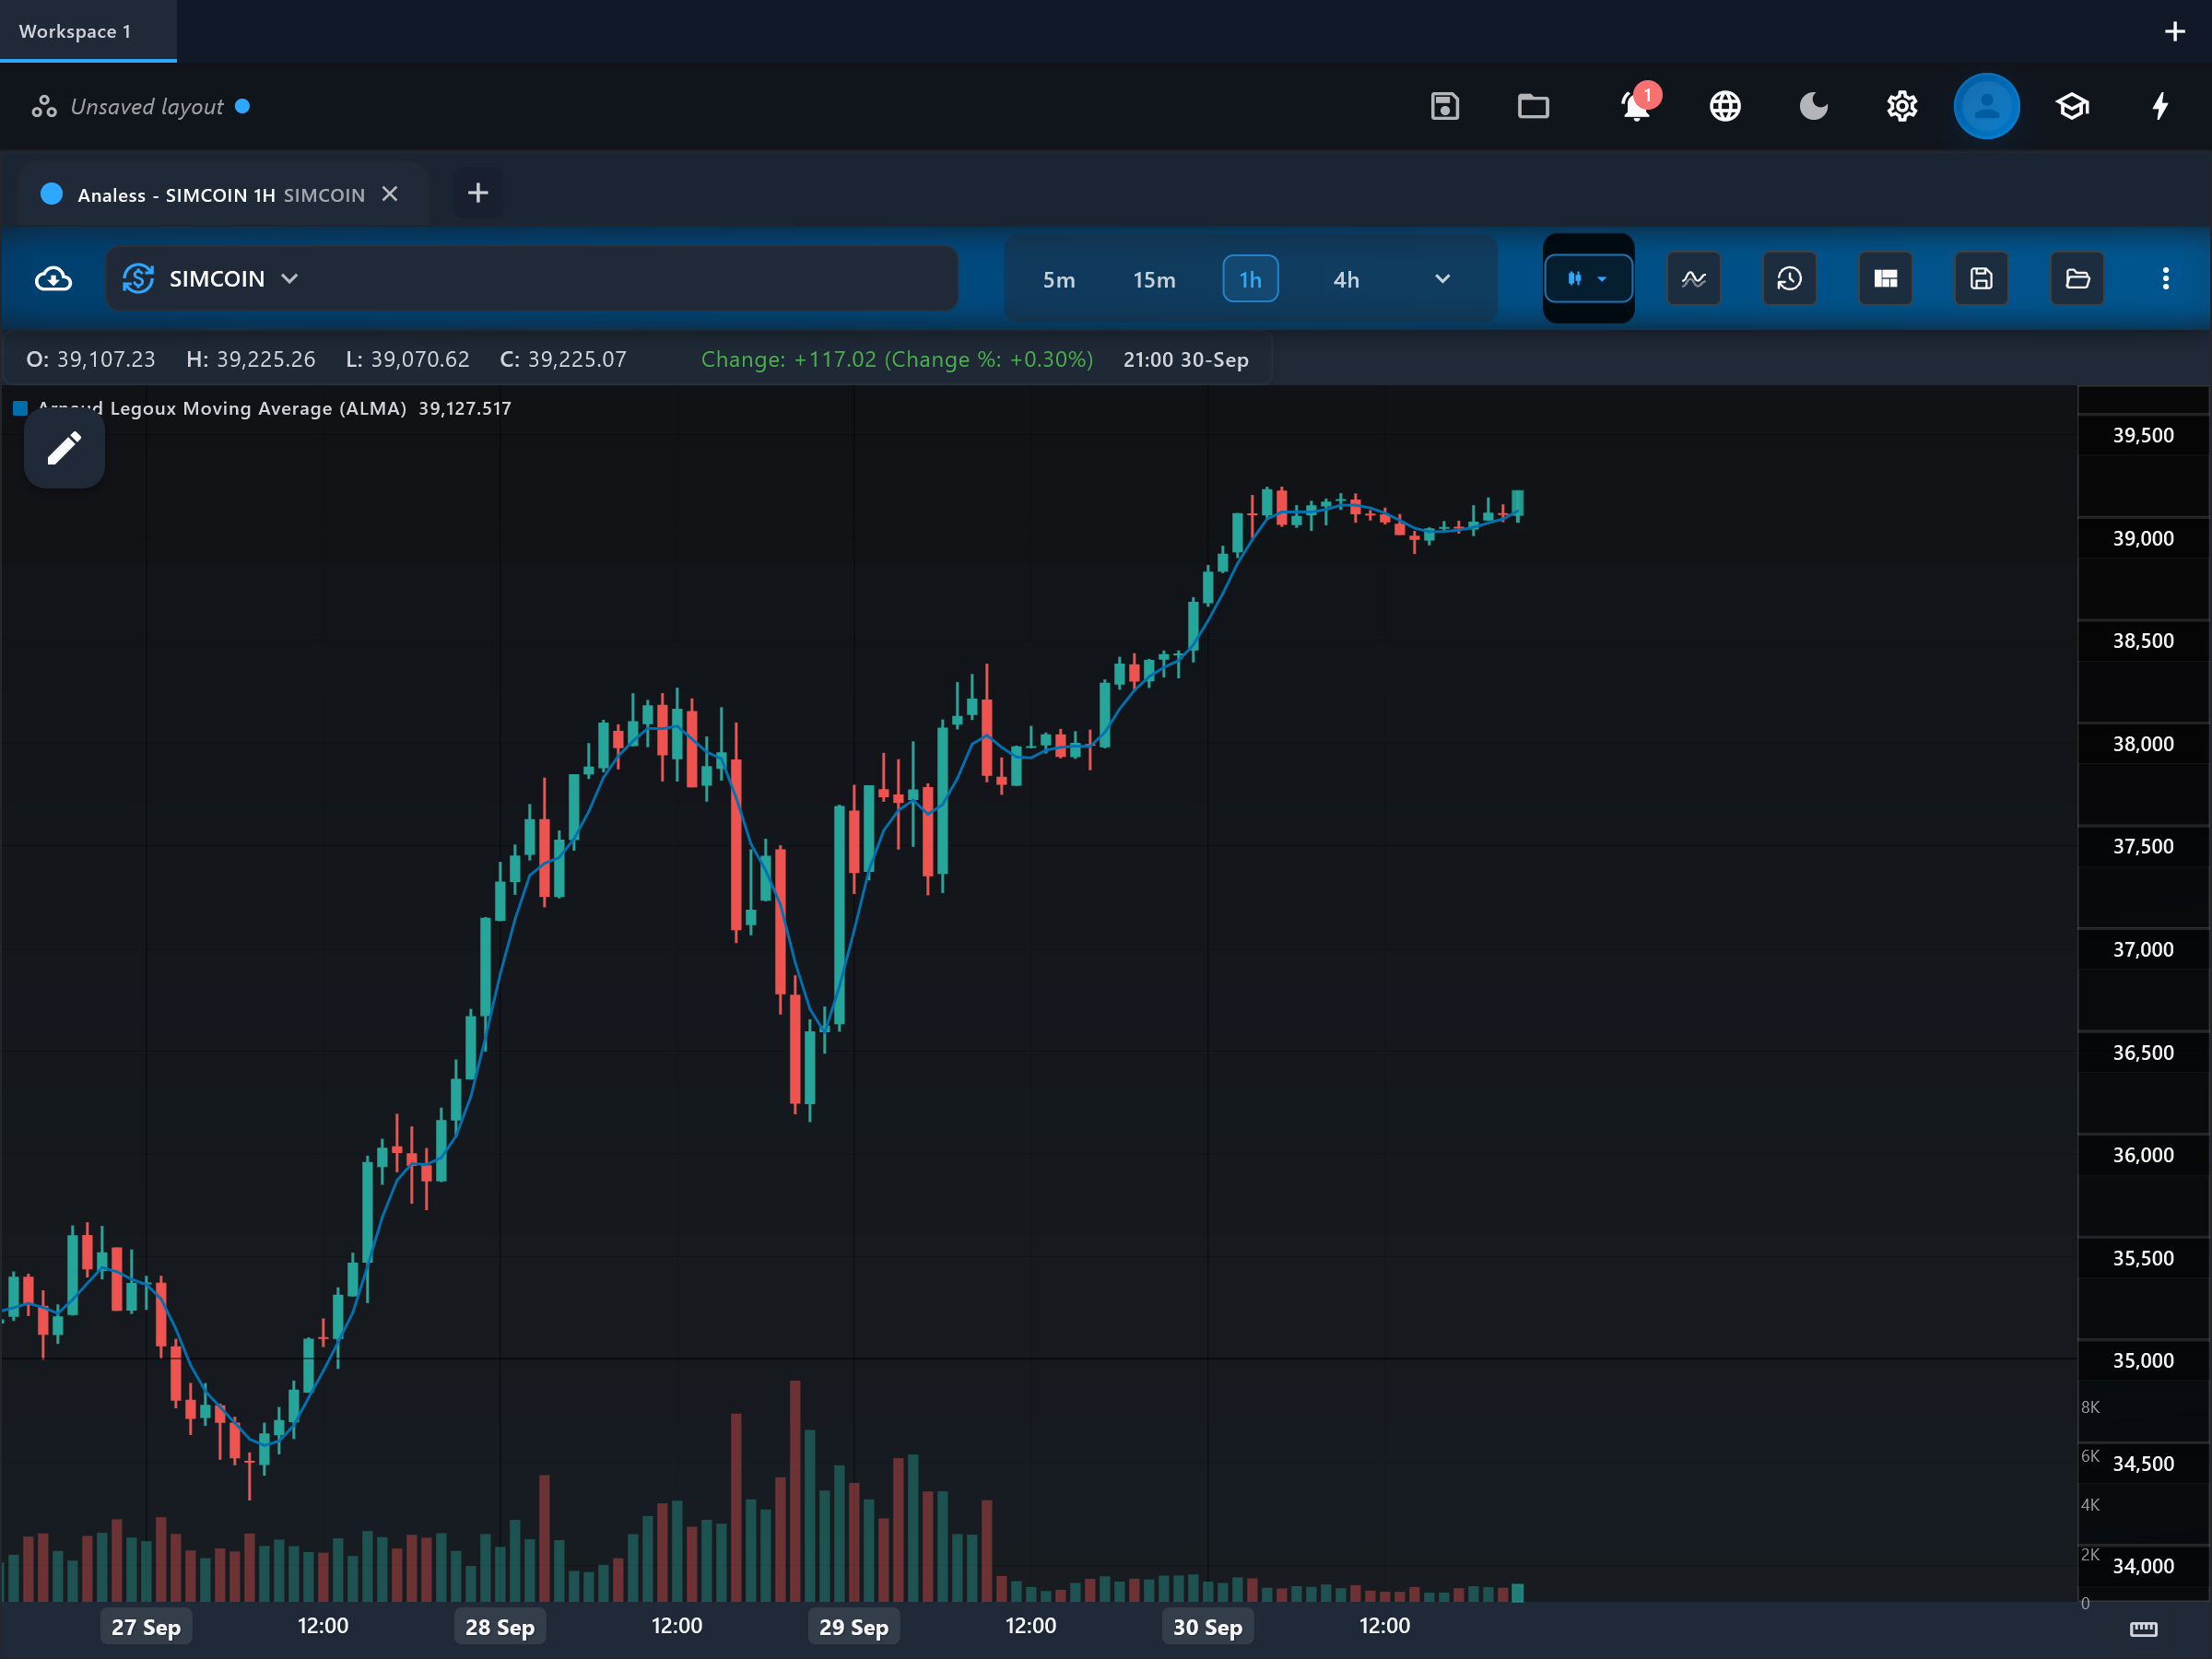
The indicator draws one line, alma, on the price chart. Read it like a low-noise trend line: its slope indicates the short-term trend, and because the Gaussian filter suppresses isolated spikes, a change in its direction is more meaningful than the same change in a raw EMA. Price holding above a rising alma line supports long positions; price below a falling line supports shorts. A flattening line warns the move is stalling.
What to look for
- Price crossUpside
Price closes above the alma line after a decline — an early trend-change condition thanks to the reduced lag.
- Price crossDownside
Price closes below the alma line after an advance — the bearish mirror.
- Trend filterContext
The slope of the alma line filters trades: its Gaussian smoothing makes slope changes less frequent and more trustworthy than on comparable-length EMAs.
- Signal-line crossContext
Running two ALMAs of different lengths and trading their crossover is a common lower-whipsaw alternative to an EMA crossover.
When to use it
ALMA is popular among forex and crypto intraday traders, where noise suppression matters most, and works equally well on daily equity charts. It suits fast timeframes (5-minute to 1-hour) better than most averages because of its noise filtering. Like all moving averages it degrades in flat ranges, though its whipsaws are typically fewer.
Works well with
Settings explained
period- Default 9. Raising it widens the Gaussian window for a slower, smoother line; lowering it tracks price more tightly. Longer settings such as 21 or 50 suit higher timeframes.
offset- Default 0.85. Slides the bell peak within the window: values toward 1 weight the newest bars (less lag, less smoothing), values toward 0 weight older bars (more smoothing, more lag). 0.5 centers the window.
sigma- Default 6. Controls bell width via period / sigma: raising sigma narrows the bell so fewer bars dominate (sharper, more reactive); lowering it spreads weight across the window (smoother, slower).
source- Default close. The Gaussian weights are applied to this price field; close is standard.
Limitations and common mistakes
- Despite the reduced lag it remains a lagging, smoothing filter — it cannot anticipate turns.
- Three interacting parameters (period, offset, sigma) invite overfitting to past data.
- The high default offset means sudden reversals can still cut through the line before it reacts.
References
- Origin: Arnaud Legoux and Dimitrios Kouzis-Loukas, 2009.
This page explains how an indicator is calculated and read. It describes past data, not what price will do next, and it is not a recommendation to trade. Read the disclaimers.
Try it in Analess
Add Arnaud Legoux Moving Average (ALMA) to any chart, adjust its settings, and open this explainer from the indicator itself.