















Indicators · Moving averages
KAMA
Kaufman’s Adaptive Moving Average — speeds up in trends and slows down in noise.
Origin: Perry Kaufman, 1998
- Best suited to
- Any market condition
- Responsiveness
- Lagging
- Family
- Moving averages
What it is
The Kaufman Adaptive Moving Average (KAMA) automatically changes its own speed based on market conditions: it moves quickly when price trends cleanly and slows to a crawl when price is noisy. This makes it one of the better moving averages for markets that alternate between trending and ranging.
How it is calculated
Each bar, KAMA measures an efficiency ratio: the net price change over the lookback period divided by the sum of all bar-to-bar changes in that period. A ratio near 1 means a clean trend, near 0 means churn. That ratio scales a smoothing constant between the fast EMA constant (fastSC) and the slow EMA constant (slowSC), and the result updates the average recursively: KAMA = KAMA_prev + SC x (close - KAMA_prev). In this app KAMA is always computed from the closing price.
How to read it
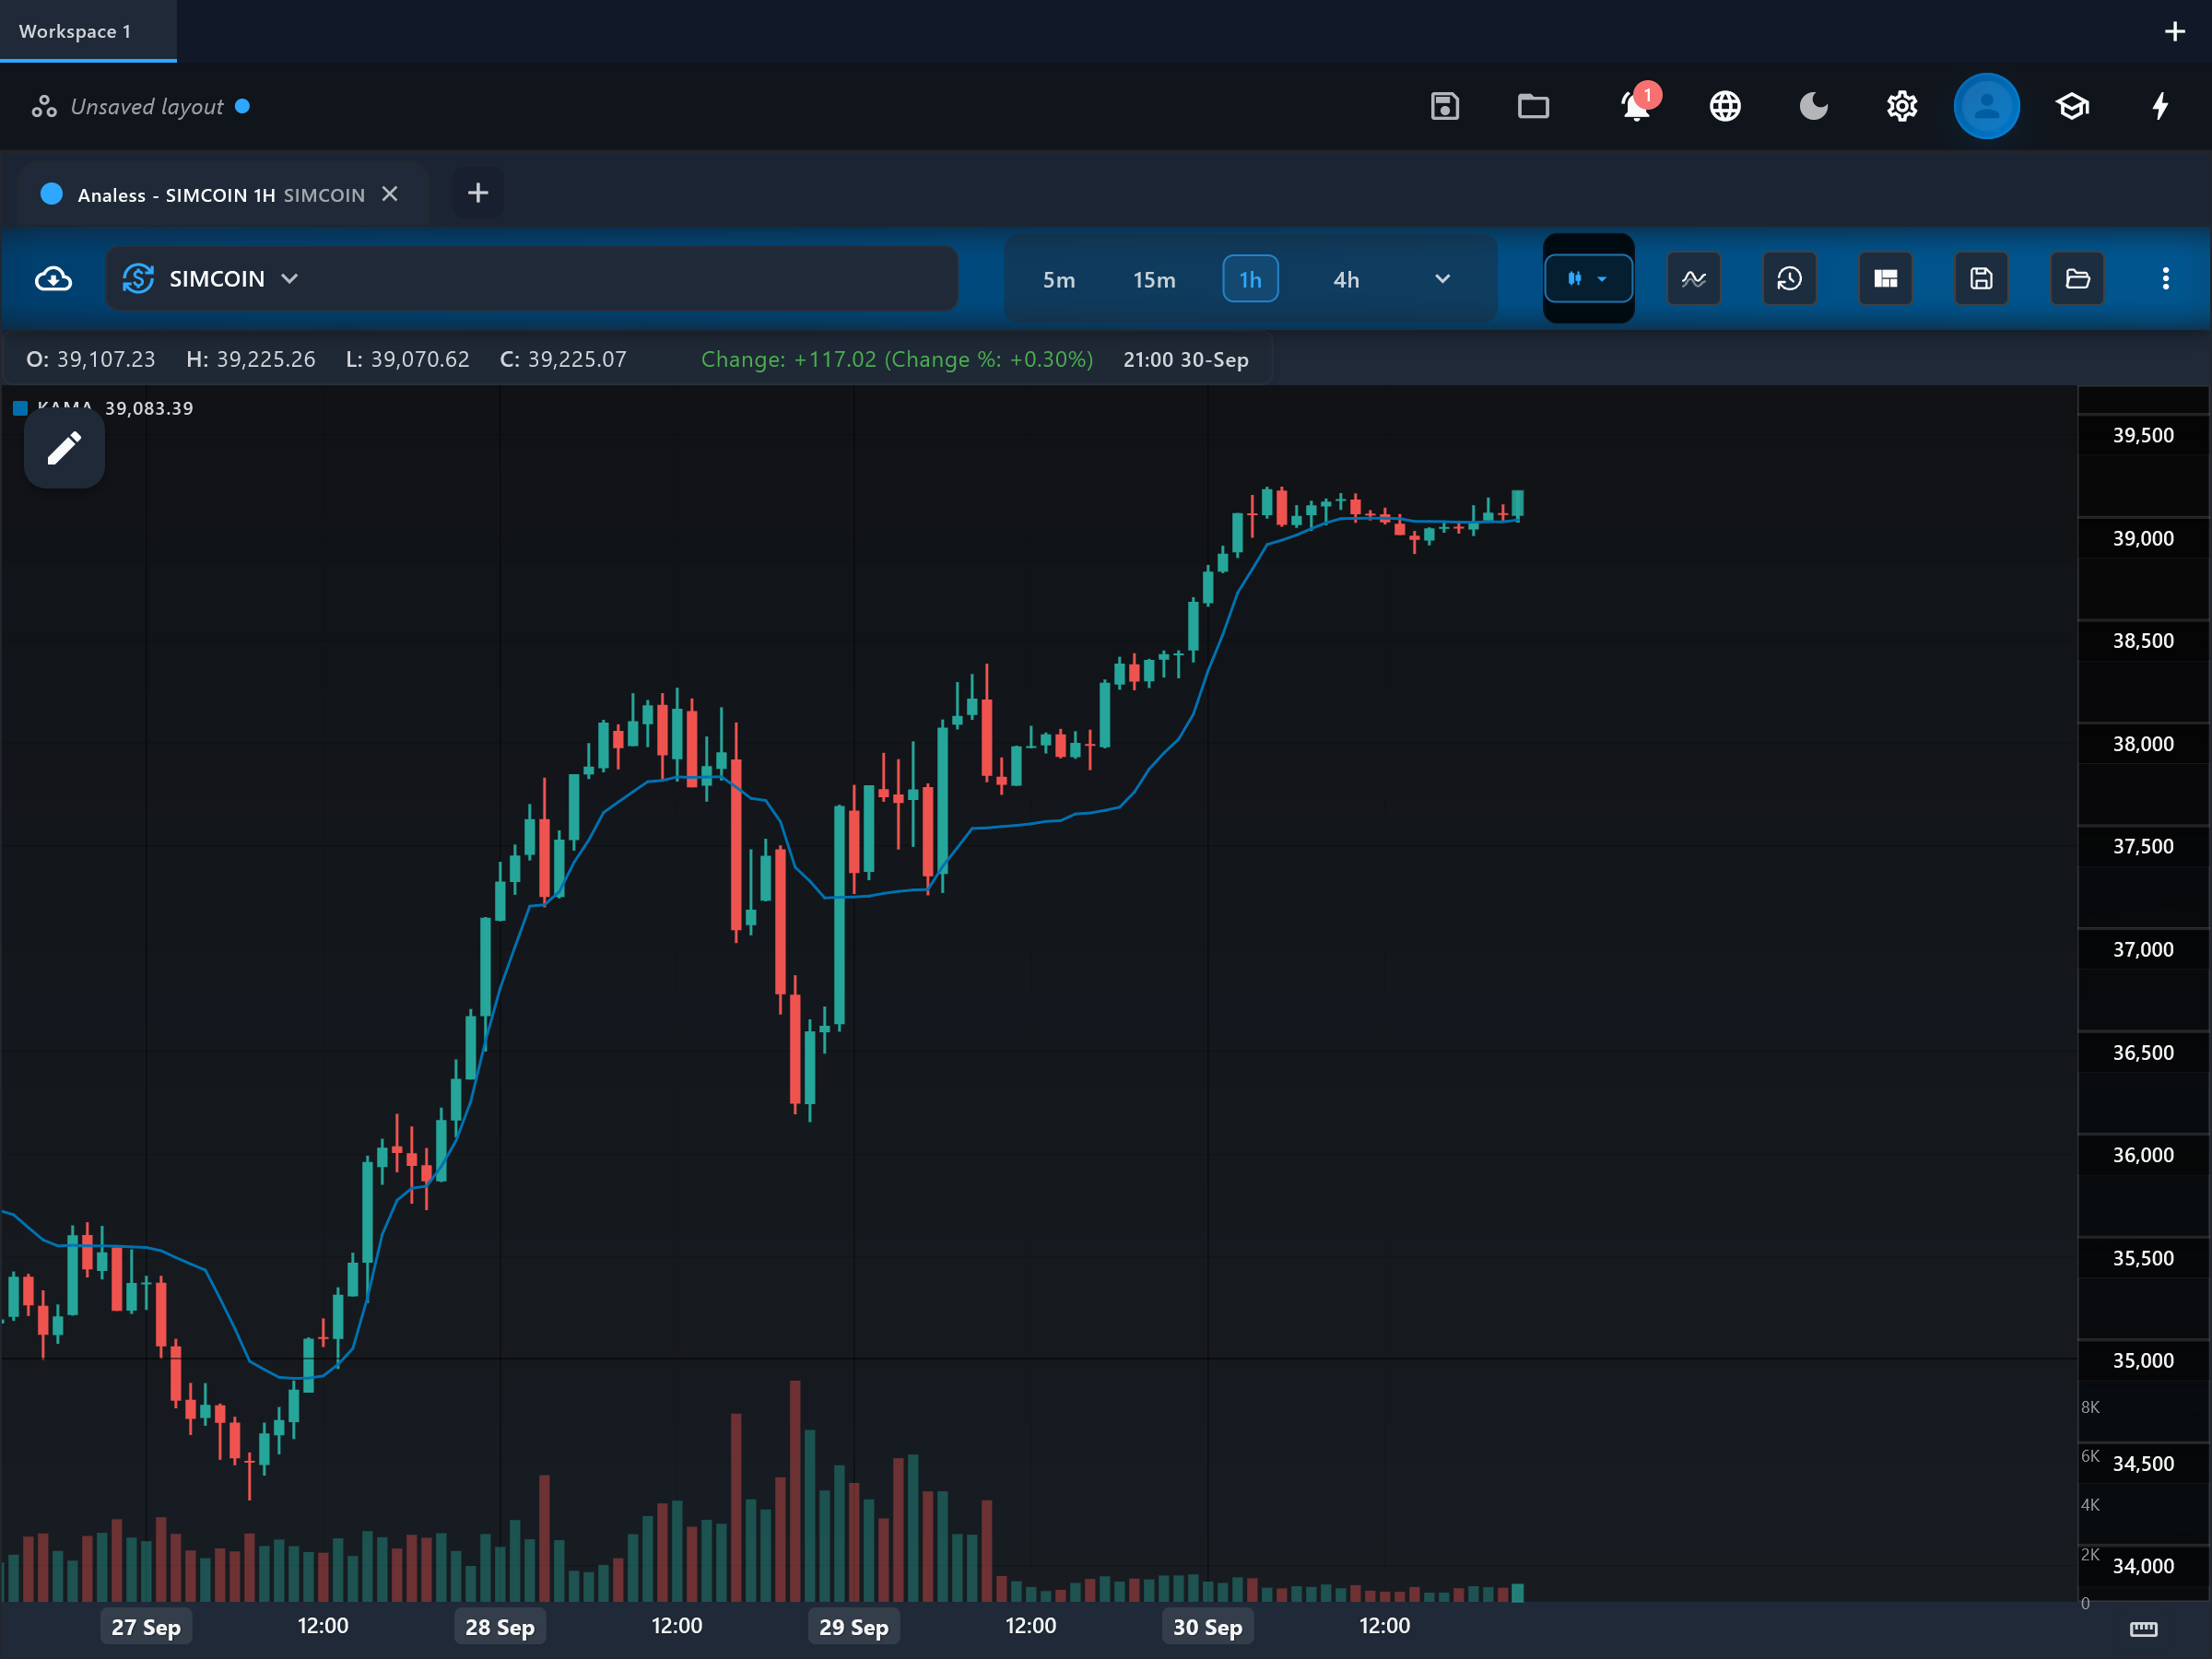
The indicator draws one line, kama_line, on the price chart. When the line angles steeply, the efficiency ratio is high and the market is trending — follow it. When kama_line goes nearly horizontal, the indicator has judged the market noisy and is deliberately ignoring price swings; treat that flatness as a stand-aside or range signal. Because the line freezes in chop, price crossing a flat kama_line means far less than price crossing a moving one.
What to look for
- Price crossUpside
Price closes above kama_line while the line begins to slope upward — an entry filtered by trend efficiency.
- Price crossDownside
Price closes below kama_line as the line turns down — the bearish counterpart.
- Trend filterContext
The slope of kama_line is a built-in regime filter: steep means trending market, flat means noisy market where trend signals should be skipped.
- ConfirmationContext
kama_line resuming its slope after a brief flat pause confirms that the prior trend has survived the consolidation.
When to use it
KAMA was developed for futures but adapts well to stocks, forex and crypto on intraday through daily timeframes — it is specifically designed for markets that switch between trend and chop, which describes most of them. It is less useful on instruments that trend almost continuously, where a plain EMA reacts faster for the same nominal length.
Works well with
Settings explained
period- Default 10. This is the efficiency-ratio lookback. Raising it judges trendiness over a longer window, making speed changes more deliberate; lowering it lets the average re-rate the market faster but more erratically.
fastSC- Default 2. The EMA length KAMA accelerates toward in a perfect trend. Lowering it is not possible below 1; raising it caps how fast the line can ever move, smoothing even strong trends.
slowSC- Default 30. The EMA length KAMA decays toward in pure noise. Raising it makes the line flatter and more stubborn in chop; lowering it lets more noise leak through when the market is ranging.
Limitations and common mistakes
- The adaptive logic needs several bars to recognize that a real breakout has started, so the first leg of a new trend is often missed.
- A sharp one-bar spike can distort the efficiency ratio and briefly accelerate the line in the wrong direction.
- Three interacting parameters make it harder to tune than a plain moving average.
References
- Origin: Perry Kaufman, 1998.
This page explains how an indicator is calculated and read. It describes past data, not what price will do next, and it is not a recommendation to trade. Read the disclaimers.
Try it in Analess
Add KAMA to any chart, adjust its settings, and open this explainer from the indicator itself.