















Indicators · Moving averages
HMA
Hull Moving Average — a fast, smooth average that reduces lag using weighted sub-averages.
Origin: Alan Hull, 2005
- Best suited to
- Trending markets
- Responsiveness
- Lagging
- Family
- Moving averages
What it is
The Hull Moving Average (HMA) is a fast, remarkably smooth moving average designed to reduce the lag that plagues traditional averages. It hugs price closely while filtering out bar-to-bar noise, making trend turns easier to spot early.
How it is calculated
The HMA combines weighted moving averages in three steps: it takes a WMA over half the period, doubles it, subtracts the full-period WMA, and then smooths that difference with a final WMA over the square root of the period — WMA(2 x WMA(n/2) - WMA(n), sqrt(n)). The doubling-and-subtracting step over-weights recent price to cancel most of the lag, and the final short WMA restores smoothness.
How to read it
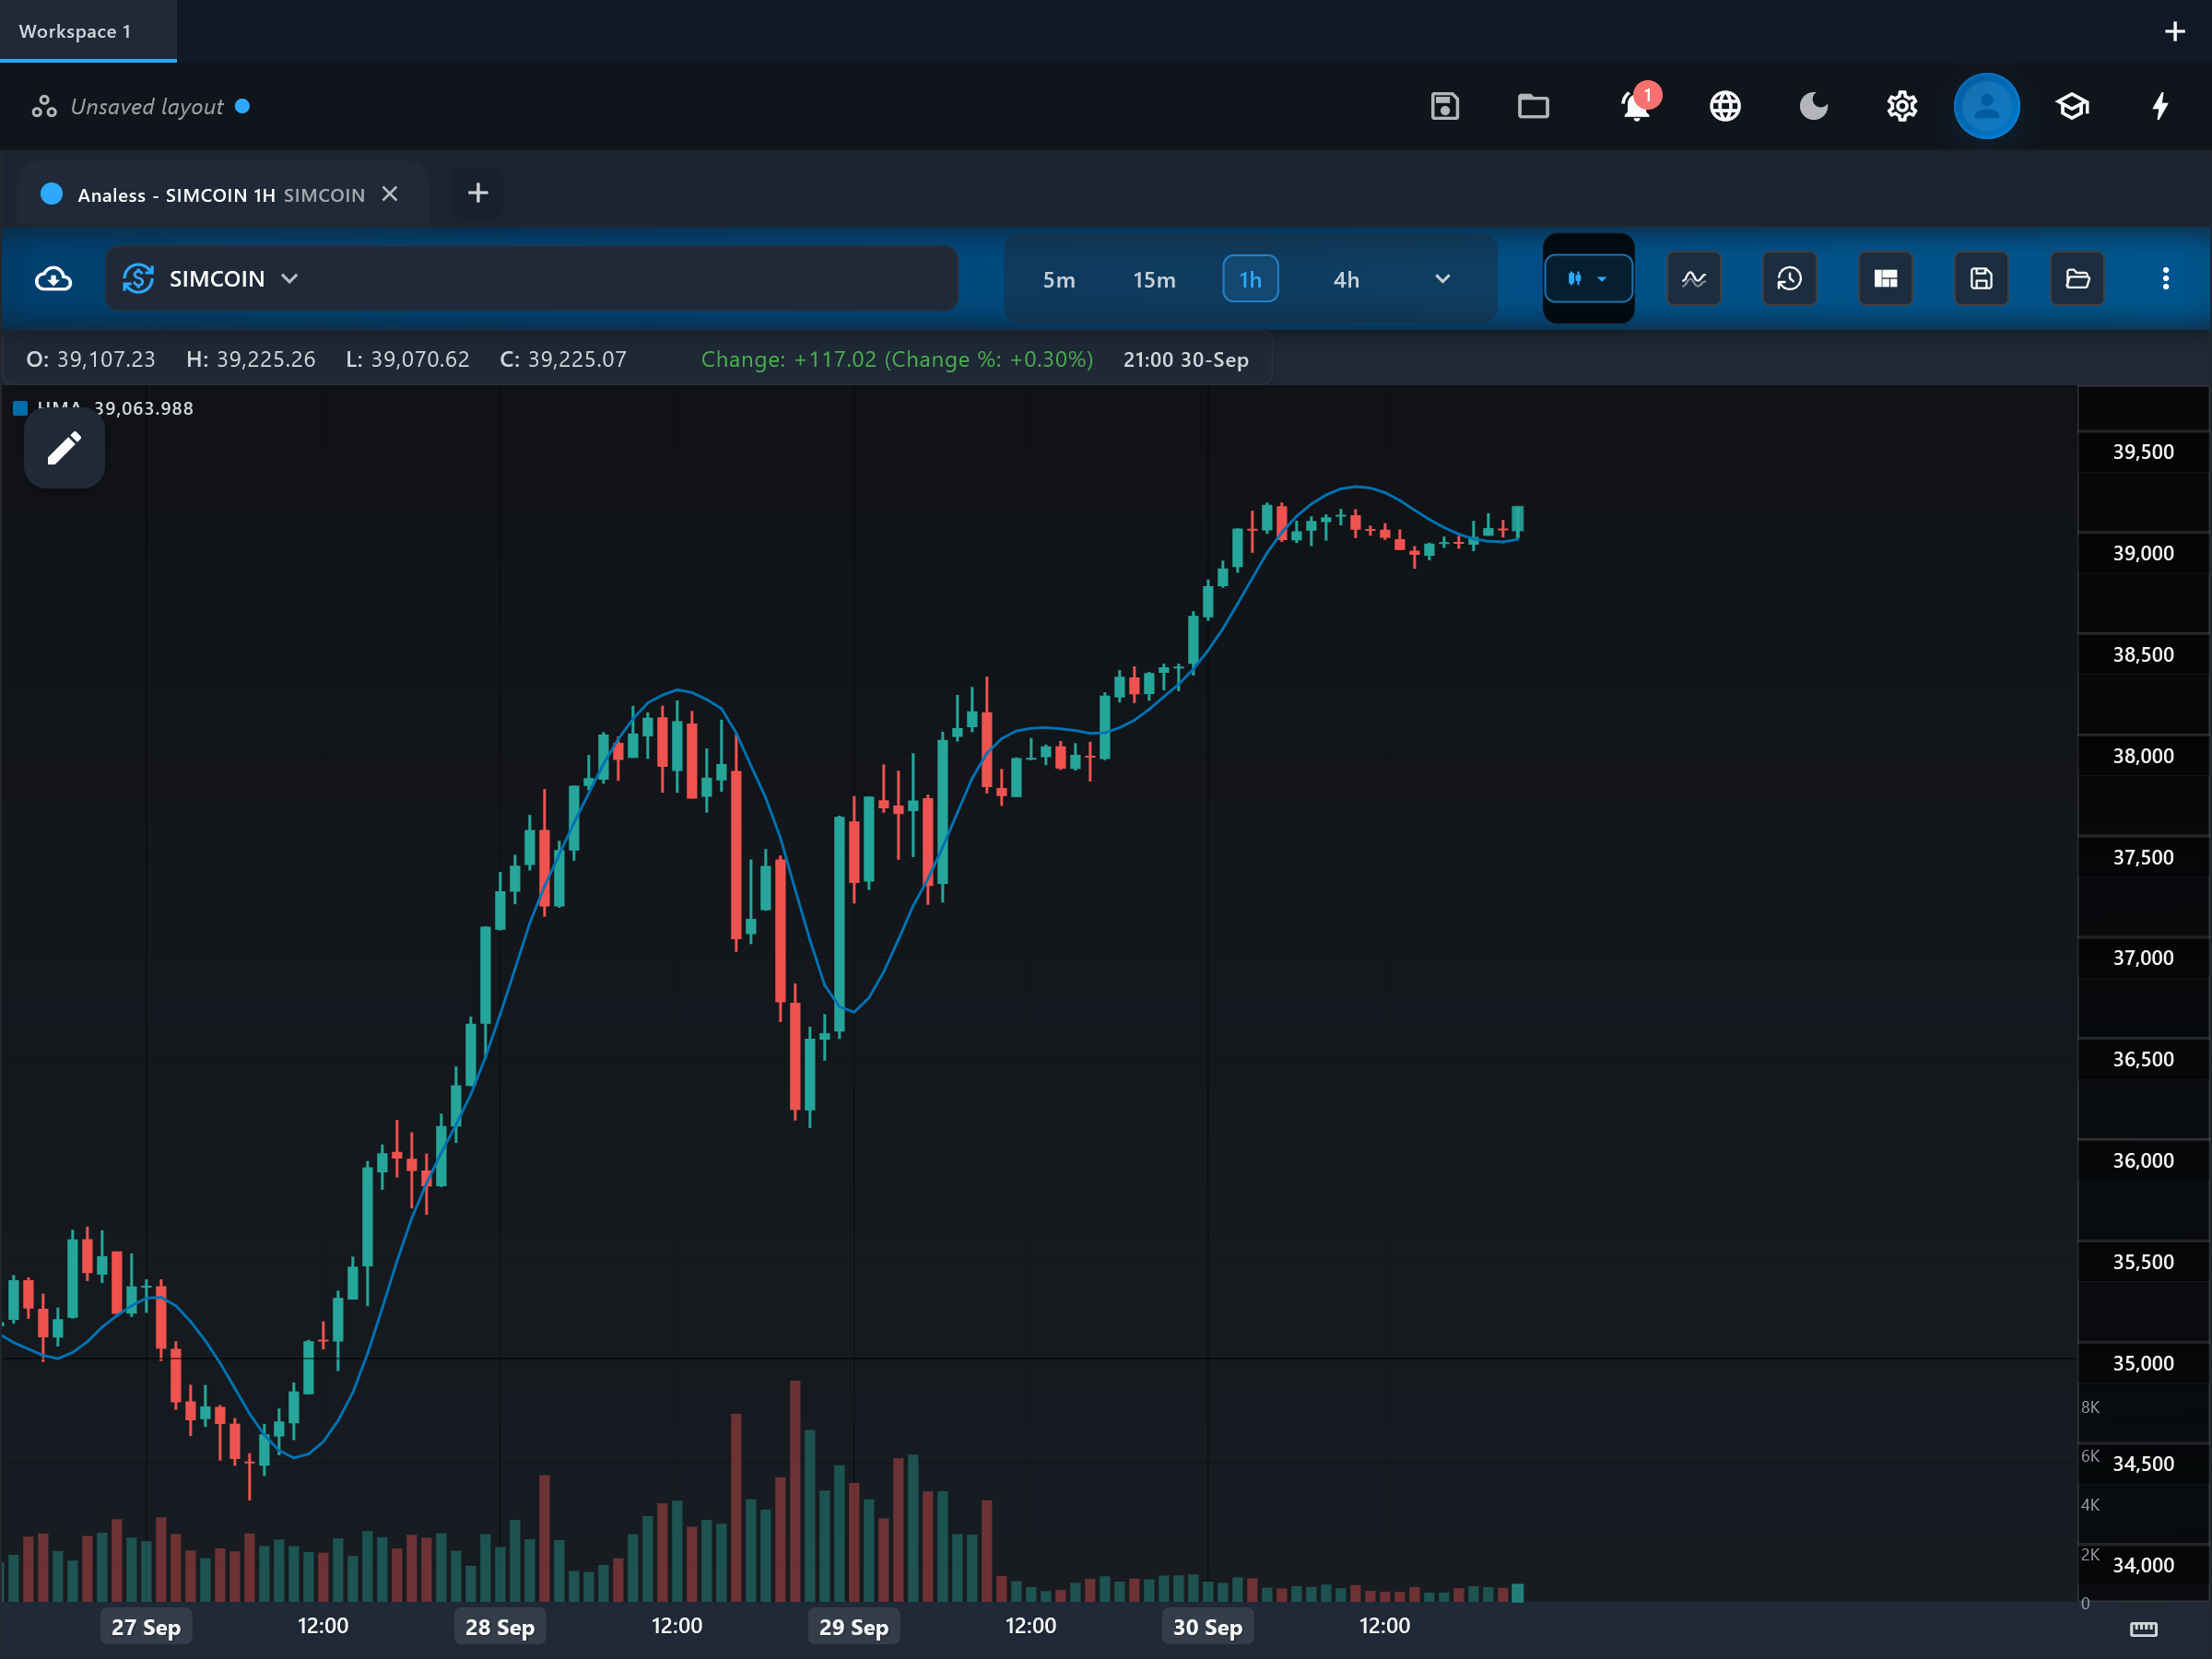
The indicator draws one line, hma, on the price chart. Because lag is largely removed, the direction of the hma line itself is the primary signal: traders commonly go with the line when it turns up and against it when it turns down, rather than waiting for price crosses. The line changes direction quickly at genuine turns but stays smooth through minor noise. In flat markets it still produces small direction flips, so a trend filter helps.
What to look for
- Trend filterContext
The slope of the hma line is the core signal: an upturn after a decline suggests a bullish swing, a downturn after a rise suggests a bearish swing.
- Price crossUpside
Price closing above a rising hma line — a momentum-aligned long condition some traders use for entries.
- Price crossDownside
Price closing below a falling hma line — the mirror-image short condition.
- ConfirmationContext
Using a longer HMA alongside a shorter one, agreement in slope between the two confirms the swing; disagreement warns of chop.
When to use it
The HMA is popular with swing traders in forex, crypto and equities on timeframes from 15 minutes to daily, and as a smoother substitute wherever an EMA would be used. Because it is built to turn quickly, it flips frequently in flat, low-volatility markets — pair it with a regime filter or avoid it when there is no trend.
Works well with
Settings explained
period- Default 21. Raising it (for example to 55) gives a slower, steadier line suited to position trading; lowering it (9 or less) makes the line extremely responsive but prone to noise flips.
source- Default close. All three internal WMAs are taken over this price field; close is the standard choice.
Limitations and common mistakes
- The lag-cancelling arithmetic causes slight overshoot: the line can swing past price at sharp turns and briefly exaggerate the move.
- It still lags by a few bars — reduced lag is not zero lag.
- In ranges its quick direction flips generate more false swing signals than a slower average would.
References
- Origin: Alan Hull, 2005.
This page explains how an indicator is calculated and read. It describes past data, not what price will do next, and it is not a recommendation to trade. Read the disclaimers.
Try it in Analess
Add HMA to any chart, adjust its settings, and open this explainer from the indicator itself.