















Indicators · Moving averages
Double Moving Average
Two moving averages of different lengths plotted together to compare short- and long-term trend.
Origin: Classical construct—no single originator
- Best suited to
- Trending markets
- Responsiveness
- Lagging
- Family
- Moving averages
What it is
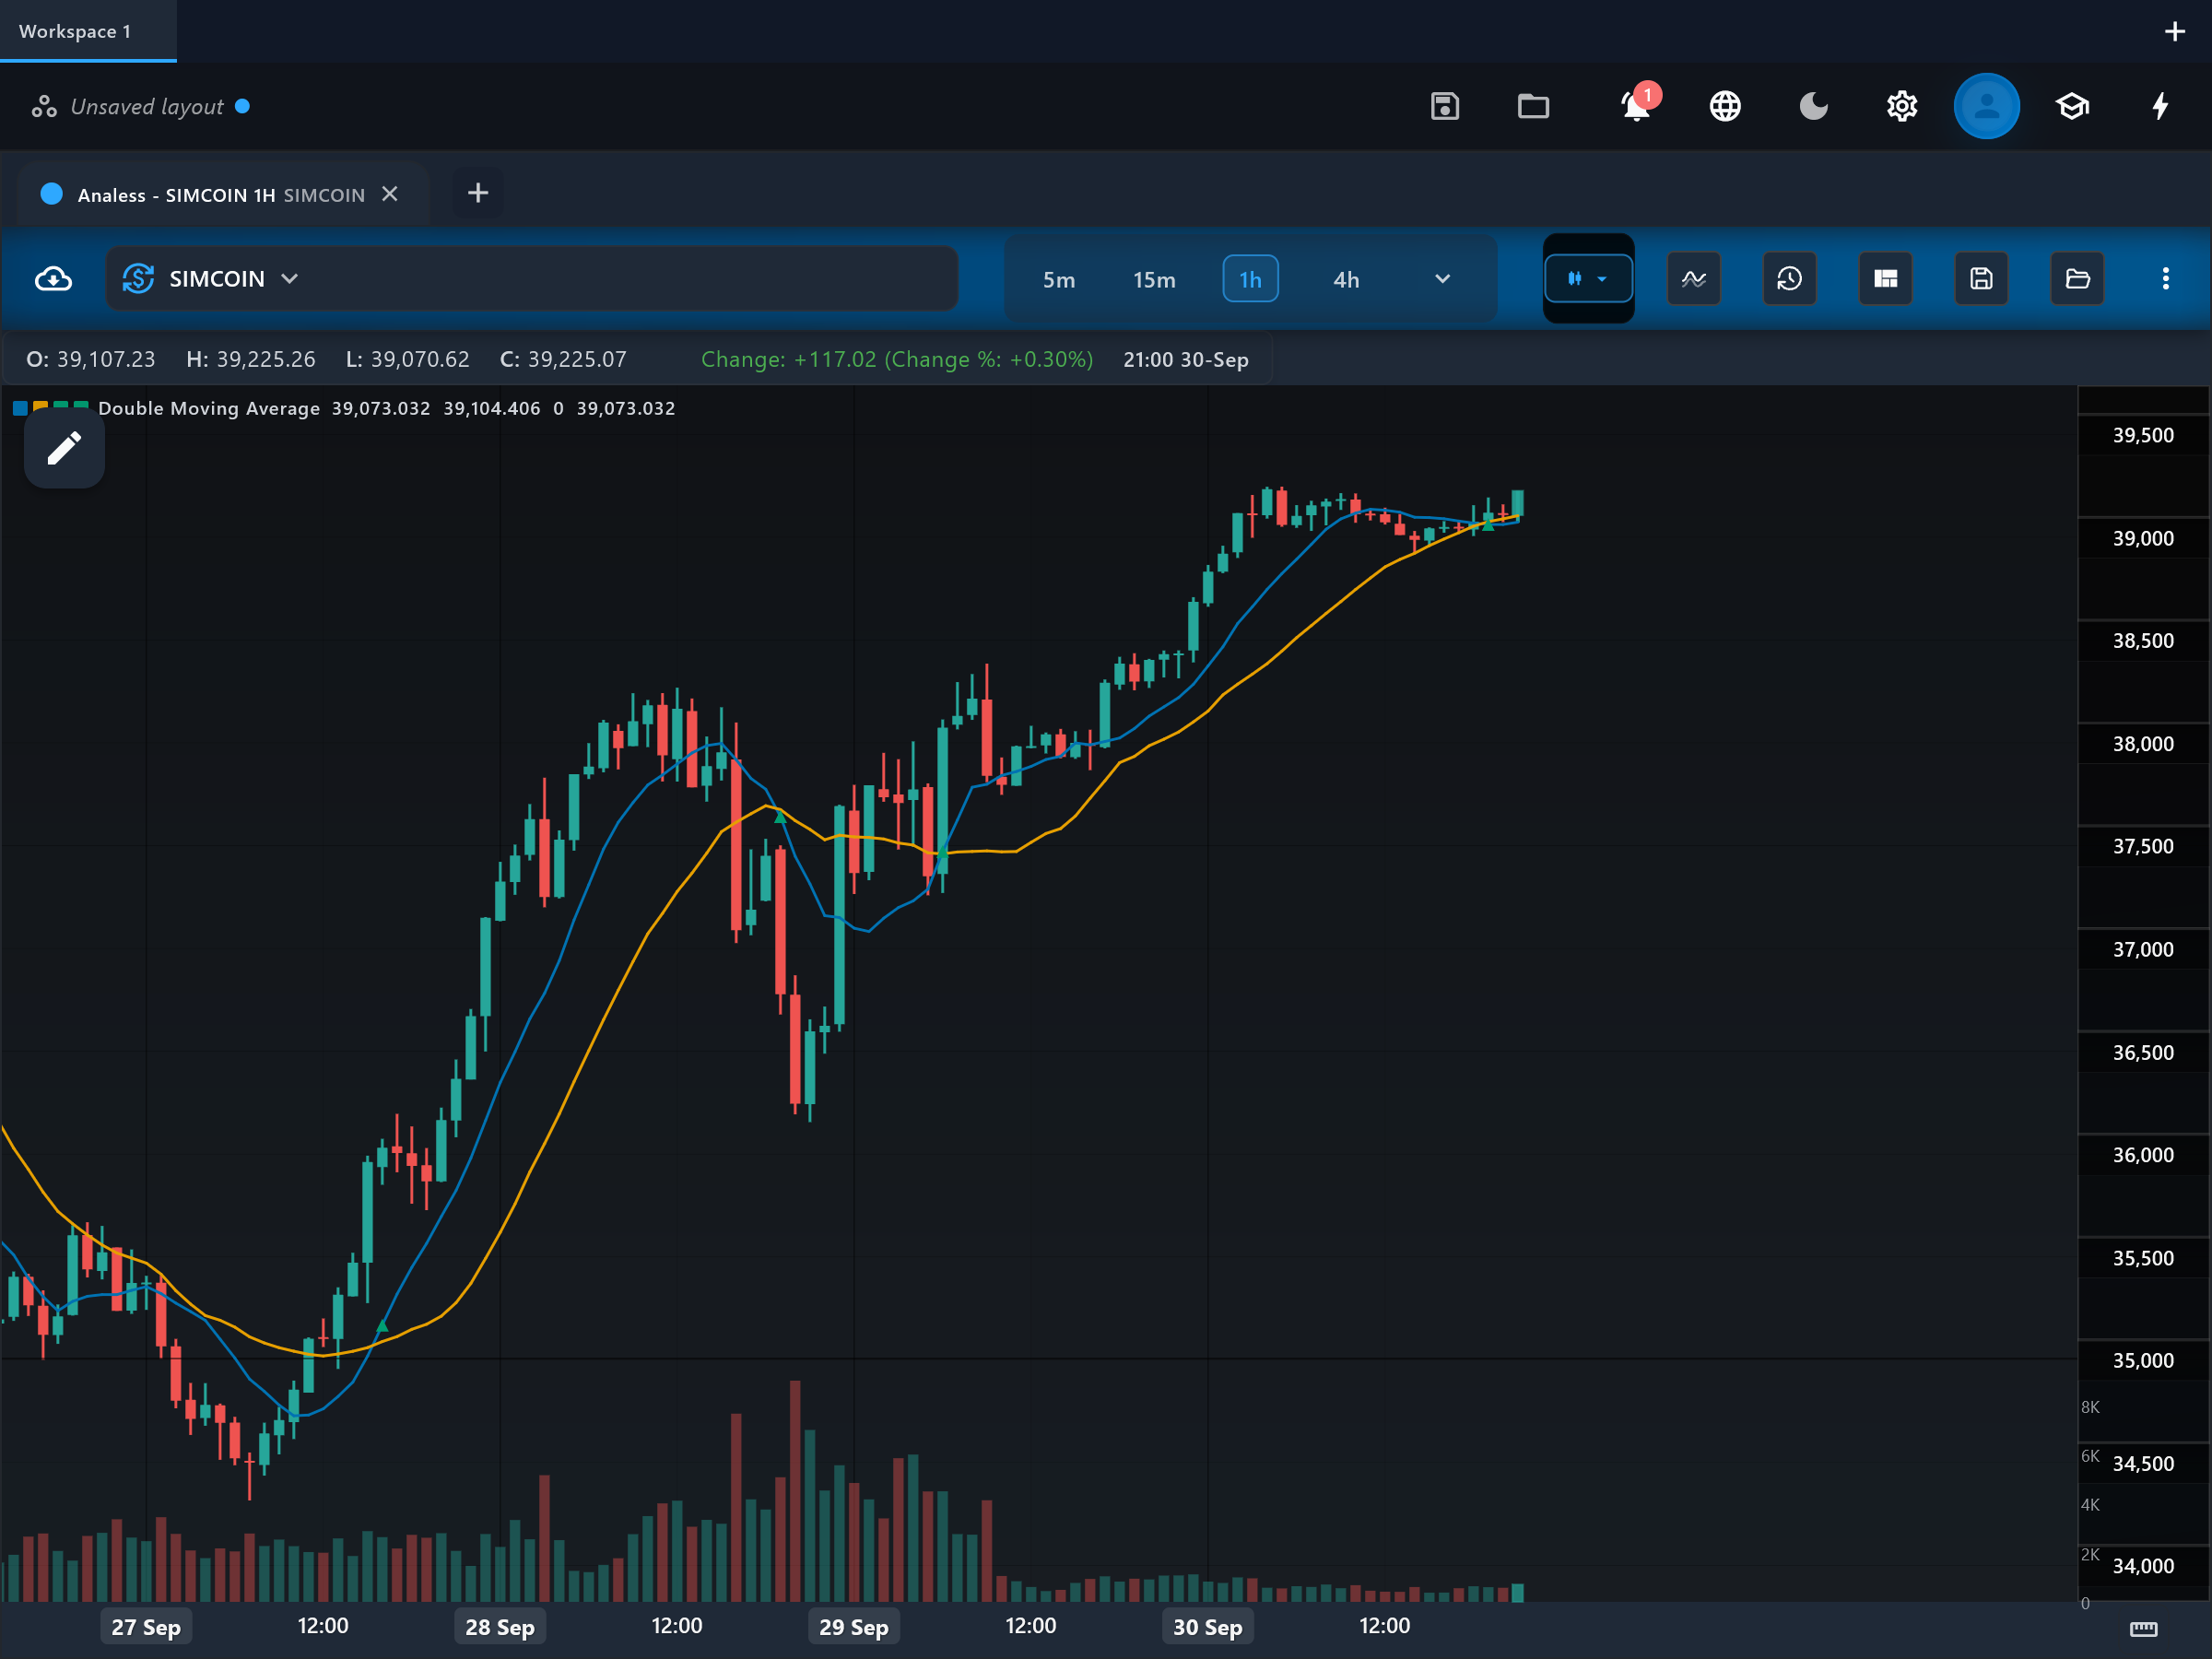
The double moving average overlays a fast and a slow moving average on the price chart and flags the moments they cross. It packages the classic two-line crossover system — such as the 50/200 golden cross — into a single indicator.
How it is calculated
Two moving averages of the same price source are computed with independent lengths and methods: a fast one over fastPeriod bars and a slow one over slowPeriod bars. Each can use the simple, exponential, weighted or linear (regression-endpoint) method. When the fast average moves from one side of the slow average to the other, the indicator prints a crossover marker on that bar.
How to read it
Three plots appear on the price chart: fast_ma, slow_ma, and crossover_signal markers at each cross. When fast_ma runs above slow_ma the shorter-term trend is up; when it runs below, the shorter-term trend is down. The wider the gap between the two lines, the stronger the trend; converging lines warn that momentum is fading. Frequent alternating markers in a tight cluster indicate a range where the system is being whipsawed.
What to look for
- Signal-line crossUpside
fast_ma crosses above slow_ma (a golden cross on longer settings) — traders often read this as the start of an uptrend.
- Signal-line crossDownside
fast_ma crosses below slow_ma (a death cross on longer settings) — commonly read as the start of a downtrend.
- Trend filterContext
The ordering of the lines is a simple regime filter: long bias while fast_ma is above slow_ma, short bias while it is below.
- ConfirmationContext
A widening gap after a cross confirms the new trend; a cross that immediately reverses suggests a false signal.
When to use it
Crossover systems are popular on daily and weekly stock and index charts (the 50/200 pair is the best-known example) and on trending forex and crypto pairs at any timeframe. They perform poorly in sideways markets, where the two lines braid around each other and produce a string of losing signals.
Works well with
Settings explained
fastPeriod- Default 10. Lowering it makes crosses fire earlier but more often; raising it delays signals and filters noise.
slowPeriod- Default 20. Raising it anchors the system to a longer trend and reduces trade frequency; lowering it makes the pair behave like two fast averages and increases whipsaws. Keep it comfortably above fastPeriod.
fastMethod- Default simple. Switching the fast line to exponential or weighted makes it react sooner to fresh price action, moving crosses earlier.
slowMethod- Default simple. A faster method on the slow line narrows the lag between the two averages; most traders leave the slow line simple for stability.
source- Default close. Both averages are computed from this price field; close is standard, while hl2 or similar blends smooth out erratic closes.
Limitations and common mistakes
- Crossovers lag: entries arrive after the turn and exits give back part of the profit.
- Range-bound markets generate repeated false crosses that can erode an account faster than one good trend repays.
- The marker only reports the fast/slow relationship — it says nothing about volume, volatility, or how far the move may travel.
References
- Origin: Classical construct—no single originator.
- Moving average crossover — Wikipedia (opens in a new tab)
This page explains how an indicator is calculated and read. It describes past data, not what price will do next, and it is not a recommendation to trade. Read the disclaimers.
Try it in Analess
Add Double Moving Average to any chart, adjust its settings, and open this explainer from the indicator itself.