















Indicators · Moving averages
McGinley Dynamic
A moving average that self-adjusts to market speed to hug price more closely.
Origin: John R. McGinley, 1990s
- Best suited to
- Trending markets
- Responsiveness
- Lagging
- Family
- Moving averages
What it is
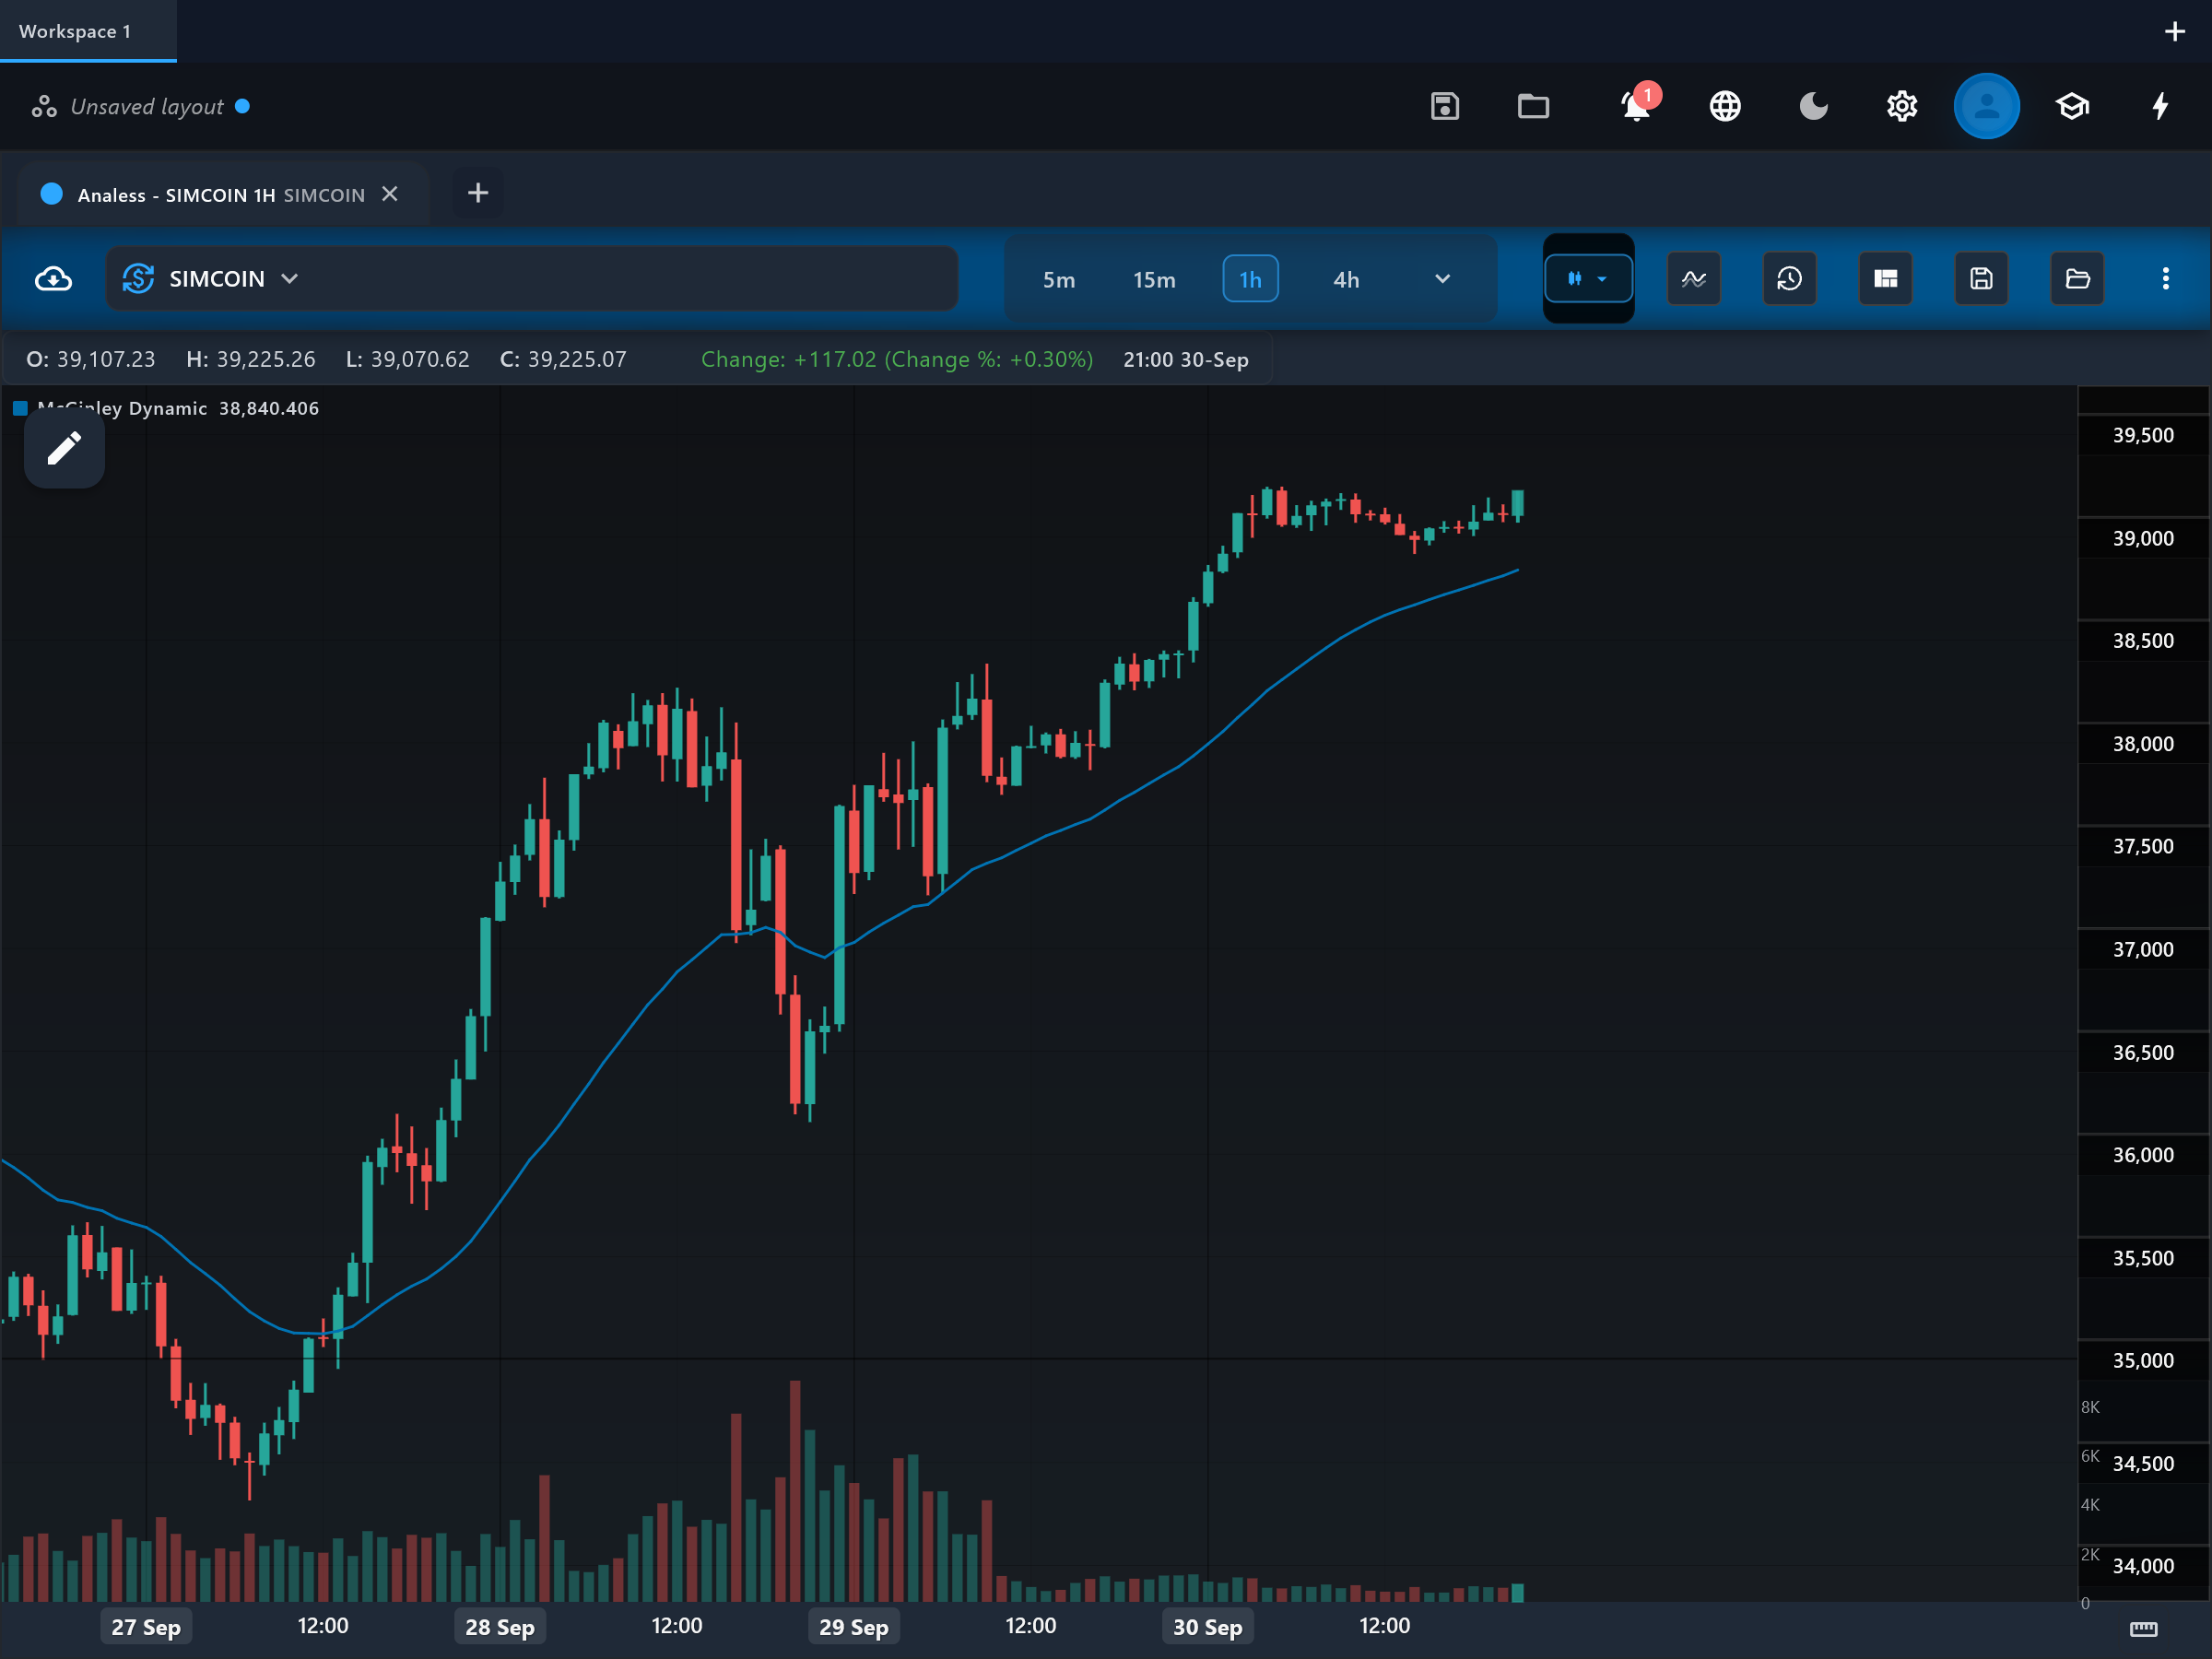
The McGinley Dynamic is a self-adjusting trend line invented to fix the two classic moving-average problems: lagging behind in fast markets and getting chopped up in slow ones. It speeds up in downmoves and hugs advances more smoothly, tracking price with fewer whipsaws than an equivalent EMA.
How it is calculated
The line updates recursively: each bar it moves toward price by an amount inversely scaled by the fourth power of the ratio of price to the line — MD = MD_prev + (price - MD_prev) / (k x N x (price / MD_prev)^4). When price runs far above the line the divisor grows and the line slows down; when price falls below, the divisor shrinks and the line accelerates, following sell-offs faster than rallies by design. In this app the constant k is the adaptationFactor parameter and the line is computed from the closing price.
How to read it
The indicator draws one line, mcginley_dynamic, on the price chart. Read it as a smarter baseline: price above a rising line means a healthy uptrend, price below a falling line a downtrend. Because the mechanism resists whipsaws, price hovering near the line for many bars is a genuine sign of equilibrium rather than indicator noise. The line tracks declines more tightly, so it tends to flag deteriorating markets sooner than an SMA or EMA of the same length.
What to look for
- Price crossUpside
Price closes above the mcginley_dynamic line after trading below it — with fewer false versions of this signal than an EMA cross of similar speed.
- Price crossDownside
Price closes below the line — meaningful because the line accelerates downward with price, making sustained closes below it harder to produce by noise.
- Trend filterContext
The slope and side of the line serve as a trend filter, the role McGinley himself intended — he described it as a market tracking tool rather than a signal generator.
- ConfirmationContext
Pullbacks that hold at the line during a trend confirm the move; use it as dynamic support or resistance.
When to use it
The McGinley Dynamic suits stocks, indices, forex and crypto on swing timeframes (1-hour to weekly), and is a drop-in replacement anywhere an EMA is used as a baseline. Its asymmetric speed — faster in declines — makes it popular for risk management. It is less suited to symmetric mean-reversion systems that need the average to behave identically in both directions.
Works well with
Settings explained
period- Default 14. Sets the baseline speed, comparable to an EMA length. Raising it slows the line for position trading; lowering it tightens it to price. McGinley noted the dynamic tracks roughly like a conventional average of a somewhat shorter length.
adaptationFactor- Default 1.0. The k constant in the divisor. Lowering it (McGinley suggested about 0.6) makes the line faster and more reactive; raising it slows the line further. It multiplies with period, so tune one at a time.
Limitations and common mistakes
- It is deliberately asymmetric — faster in falling markets — which complicates strategies that assume symmetric behavior.
- It remains a smoothing filter with lag; it will not catch V-shaped reversals at the turn.
- It is less common than SMA/EMA, so fewer market participants watch the same line, weakening any self-fulfilling support/resistance effect.
References
- Origin: John R. McGinley, 1990s.
This page explains how an indicator is calculated and read. It describes past data, not what price will do next, and it is not a recommendation to trade. Read the disclaimers.
Try it in Analess
Add McGinley Dynamic to any chart, adjust its settings, and open this explainer from the indicator itself.