















Indicators · Moving averages
GMMA
Guppy Multiple Moving Average — two ribbons of averages that set short-term traders against long-term holders.
Origin: Daryl Guppy, 1990s
- Best suited to
- Trending markets
- Responsiveness
- Lagging
- Family
- Moving averages
What it is
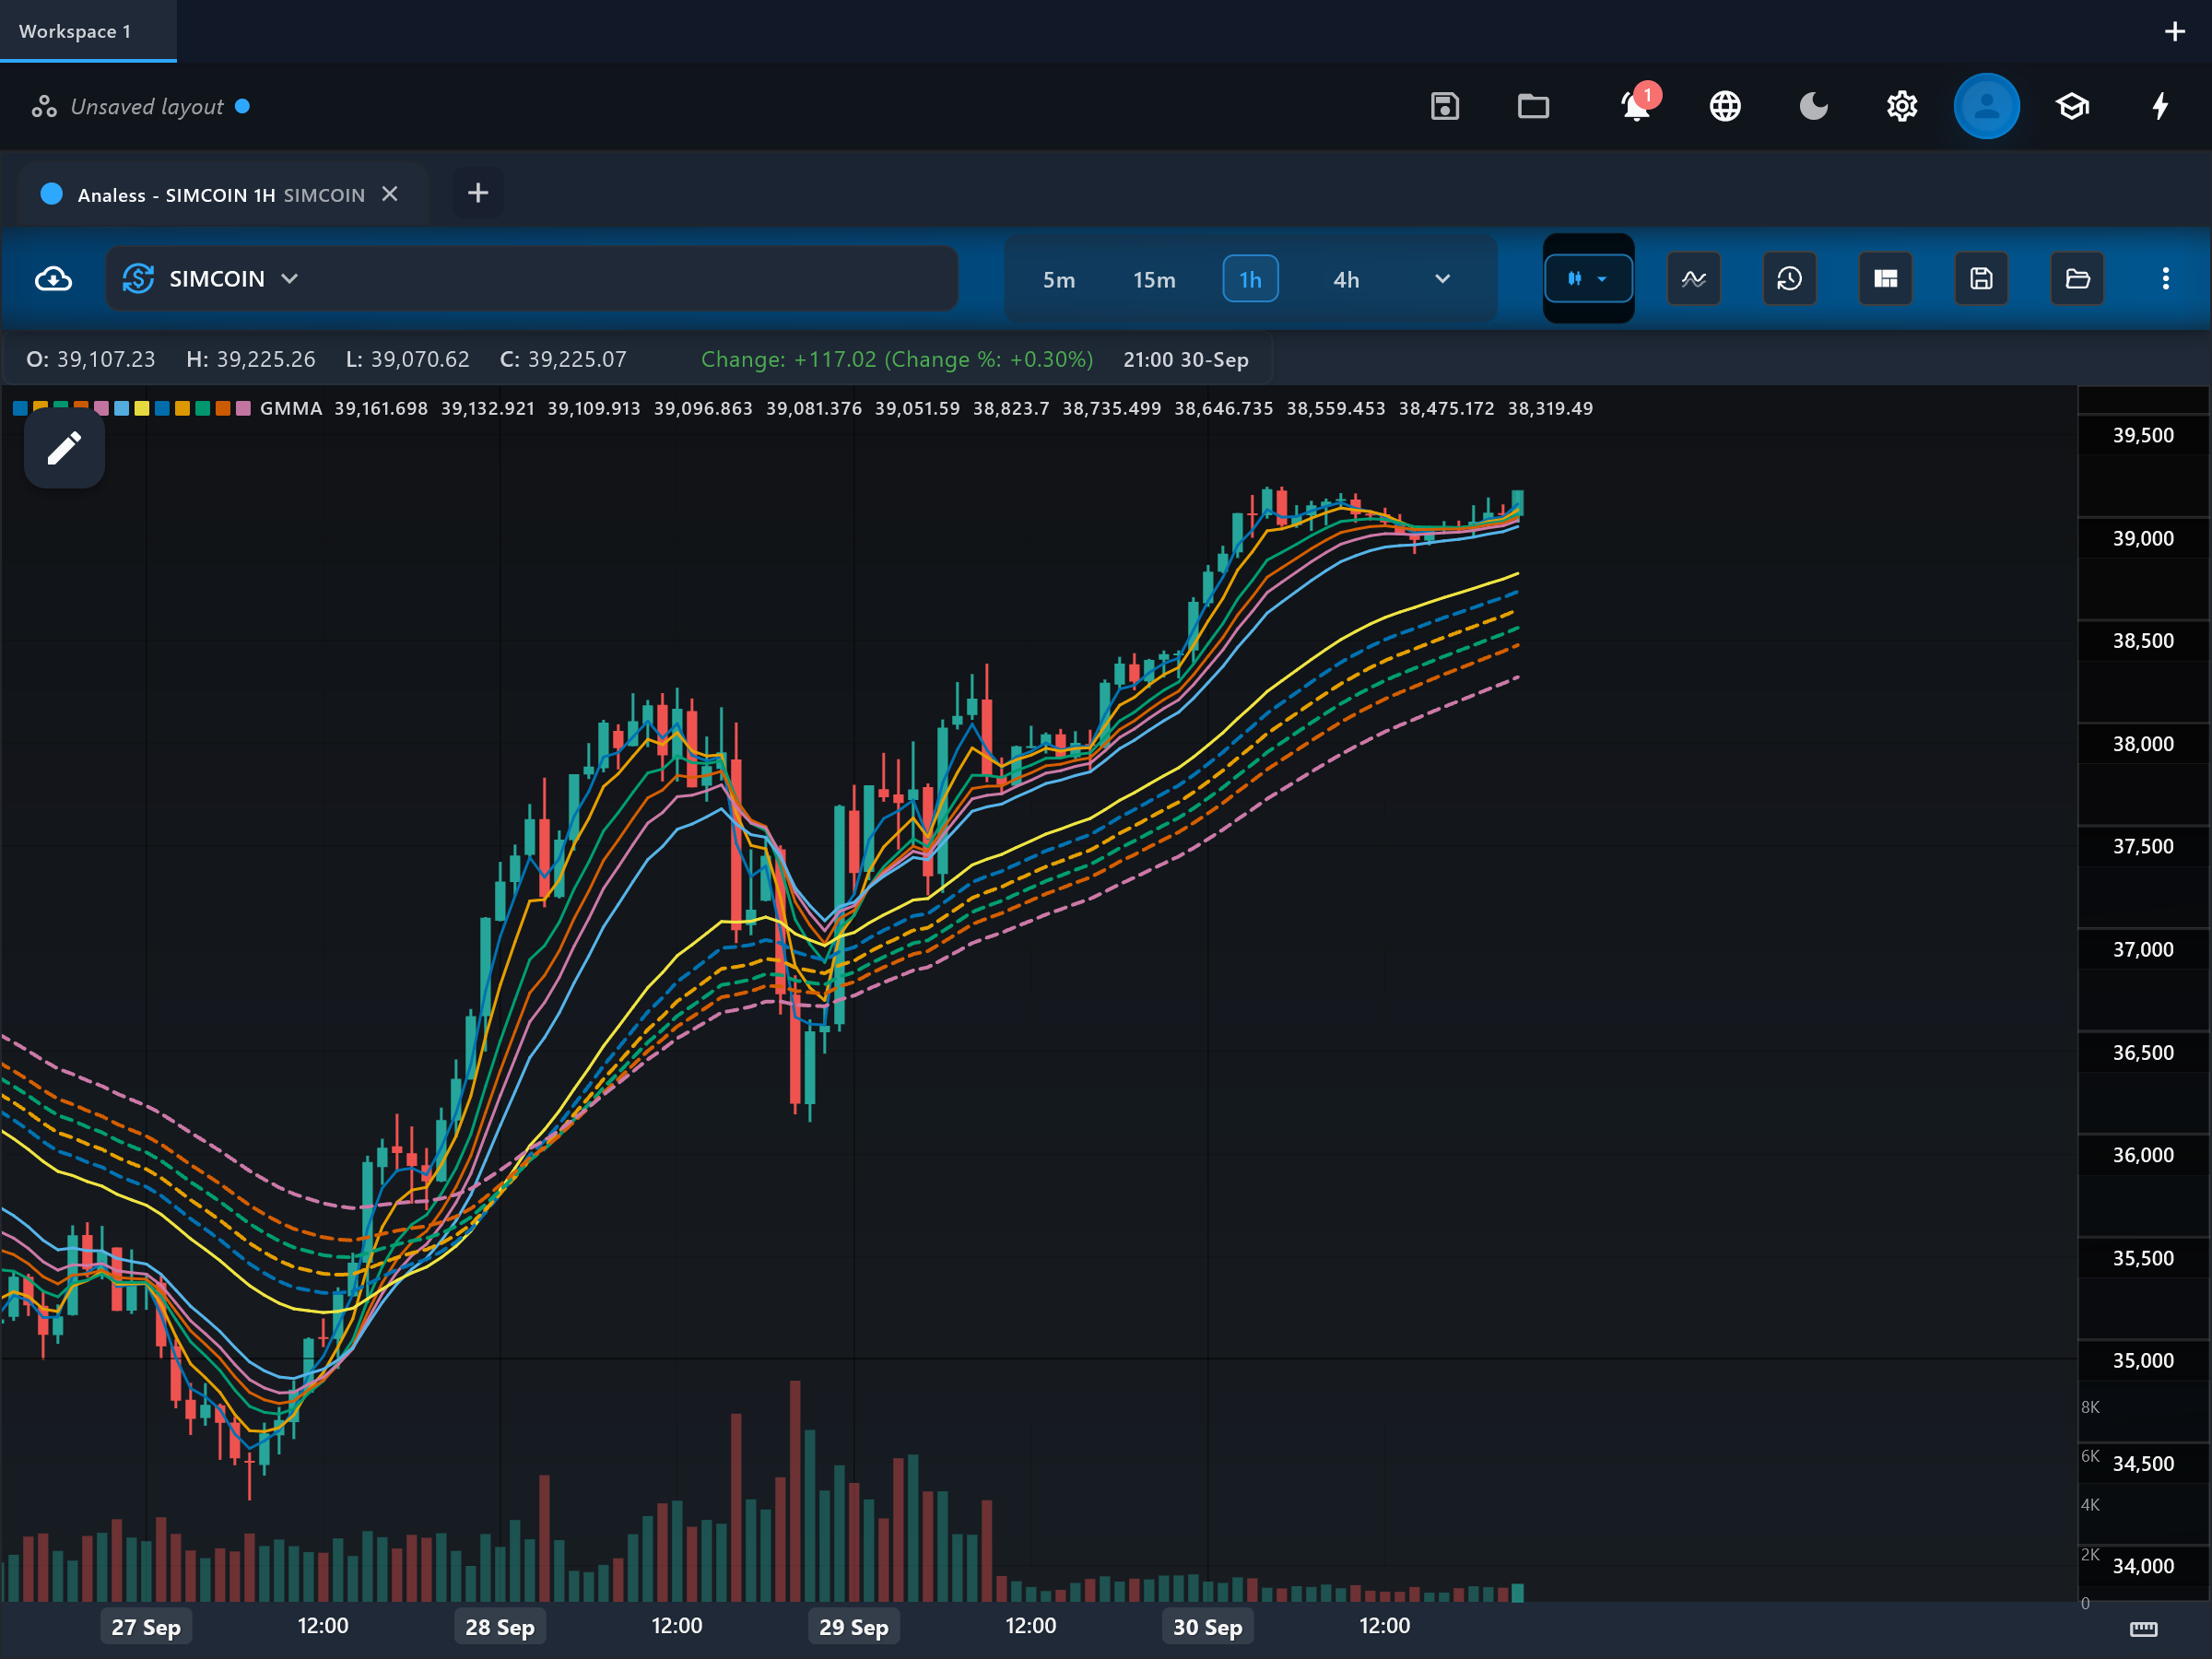
The Guppy Multiple Moving Average (GMMA) plots two ribbons of exponential moving averages: a short-term group representing traders and a long-term group representing investors. The interaction between the two ribbons shows whether short-term activity is being supported or rejected by longer-term money.
How it is calculated
Twelve EMAs of the closing price are drawn at once: six short-term lengths (3, 5, 8, 10, 12 and 15 by default) and six long-term lengths (30, 35, 40, 45, 50 and 60 by default). Each line is a standard exponential average — no further transformation is applied — so all information comes from how the two groups spread, compress, and cross.
How to read it
The plots are named after their lengths: short_3 through short_15 form the fast ribbon and long_30 through long_60 form the slow ribbon. A wide, parallel long-term ribbon shows investors are committed to the trend; a wide short-term ribbon shows strong trader participation. Compression of either group shows agreement on price. The pattern Guppy described is the short-term group compressing, crossing through the long-term group, then expanding on the other side.
What to look for
- Signal-line crossUpside
The whole short-term ribbon crosses above the long-term ribbon and both groups begin to expand — the Guppy signal of a new uptrend backed by investors.
- Signal-line crossDownside
The short-term ribbon crosses below the long-term ribbon and the long-term group rolls over — distribution turning into a downtrend.
- SqueezeContext
Both ribbons compressing into a narrow band signals agreement on value and frequently precedes a volatility expansion in either direction.
- ConfirmationContext
In an established trend, the short-term ribbon repeatedly pulling back to a wide long-term ribbon and bouncing confirms that investors are buying the dips.
- Trend filterContext
The separation and slope of the long-term ribbon acts as a trend filter: trade with it while it is wide and sloped, stand aside while it is flat and tangled.
When to use it
Guppy developed the technique on daily stock charts, and it remains most popular for swing and position trading in equities, indices and crypto on 4-hour to weekly timeframes. Twelve lines are hard to read on very fast intraday charts, and in prolonged ranges the ribbons stay tangled and give little usable information.
Works well with
Settings explained
shortTermPeriods- Default 3, 5, 8, 10, 12, 15. These lengths define the trader ribbon; shortening them makes the fast group more reactive, while adding longer values blurs the boundary with the investor ribbon. Most users keep the classic set.
longTermPeriods- Default 30, 35, 40, 45, 50, 60. These define the investor ribbon; raising them slows the baseline trend and widens the gap between the groups, lowering them makes the whole system shorter-term.
Limitations and common mistakes
- All twelve lines are lagging EMAs — the ribbon confirms trends, it does not predict them.
- In sideways markets the ribbons intertwine and produce no readable structure.
- The display is visually busy and interpretation of ribbon width is partly subjective, which makes rigid backtesting difficult.
References
- Origin: Daryl Guppy, 1990s.
This page explains how an indicator is calculated and read. It describes past data, not what price will do next, and it is not a recommendation to trade. Read the disclaimers.
Try it in Analess
Add GMMA to any chart, adjust its settings, and open this explainer from the indicator itself.