















Indicators · Momentum & oscillators
Coppock Curve
A long-term momentum measure originally built to study major lows.
Origin: Edwin S. C. Coppock, 1962
- Best suited to
- Trending markets
- Responsiveness
- Lagging
- Family
- Momentum & oscillators
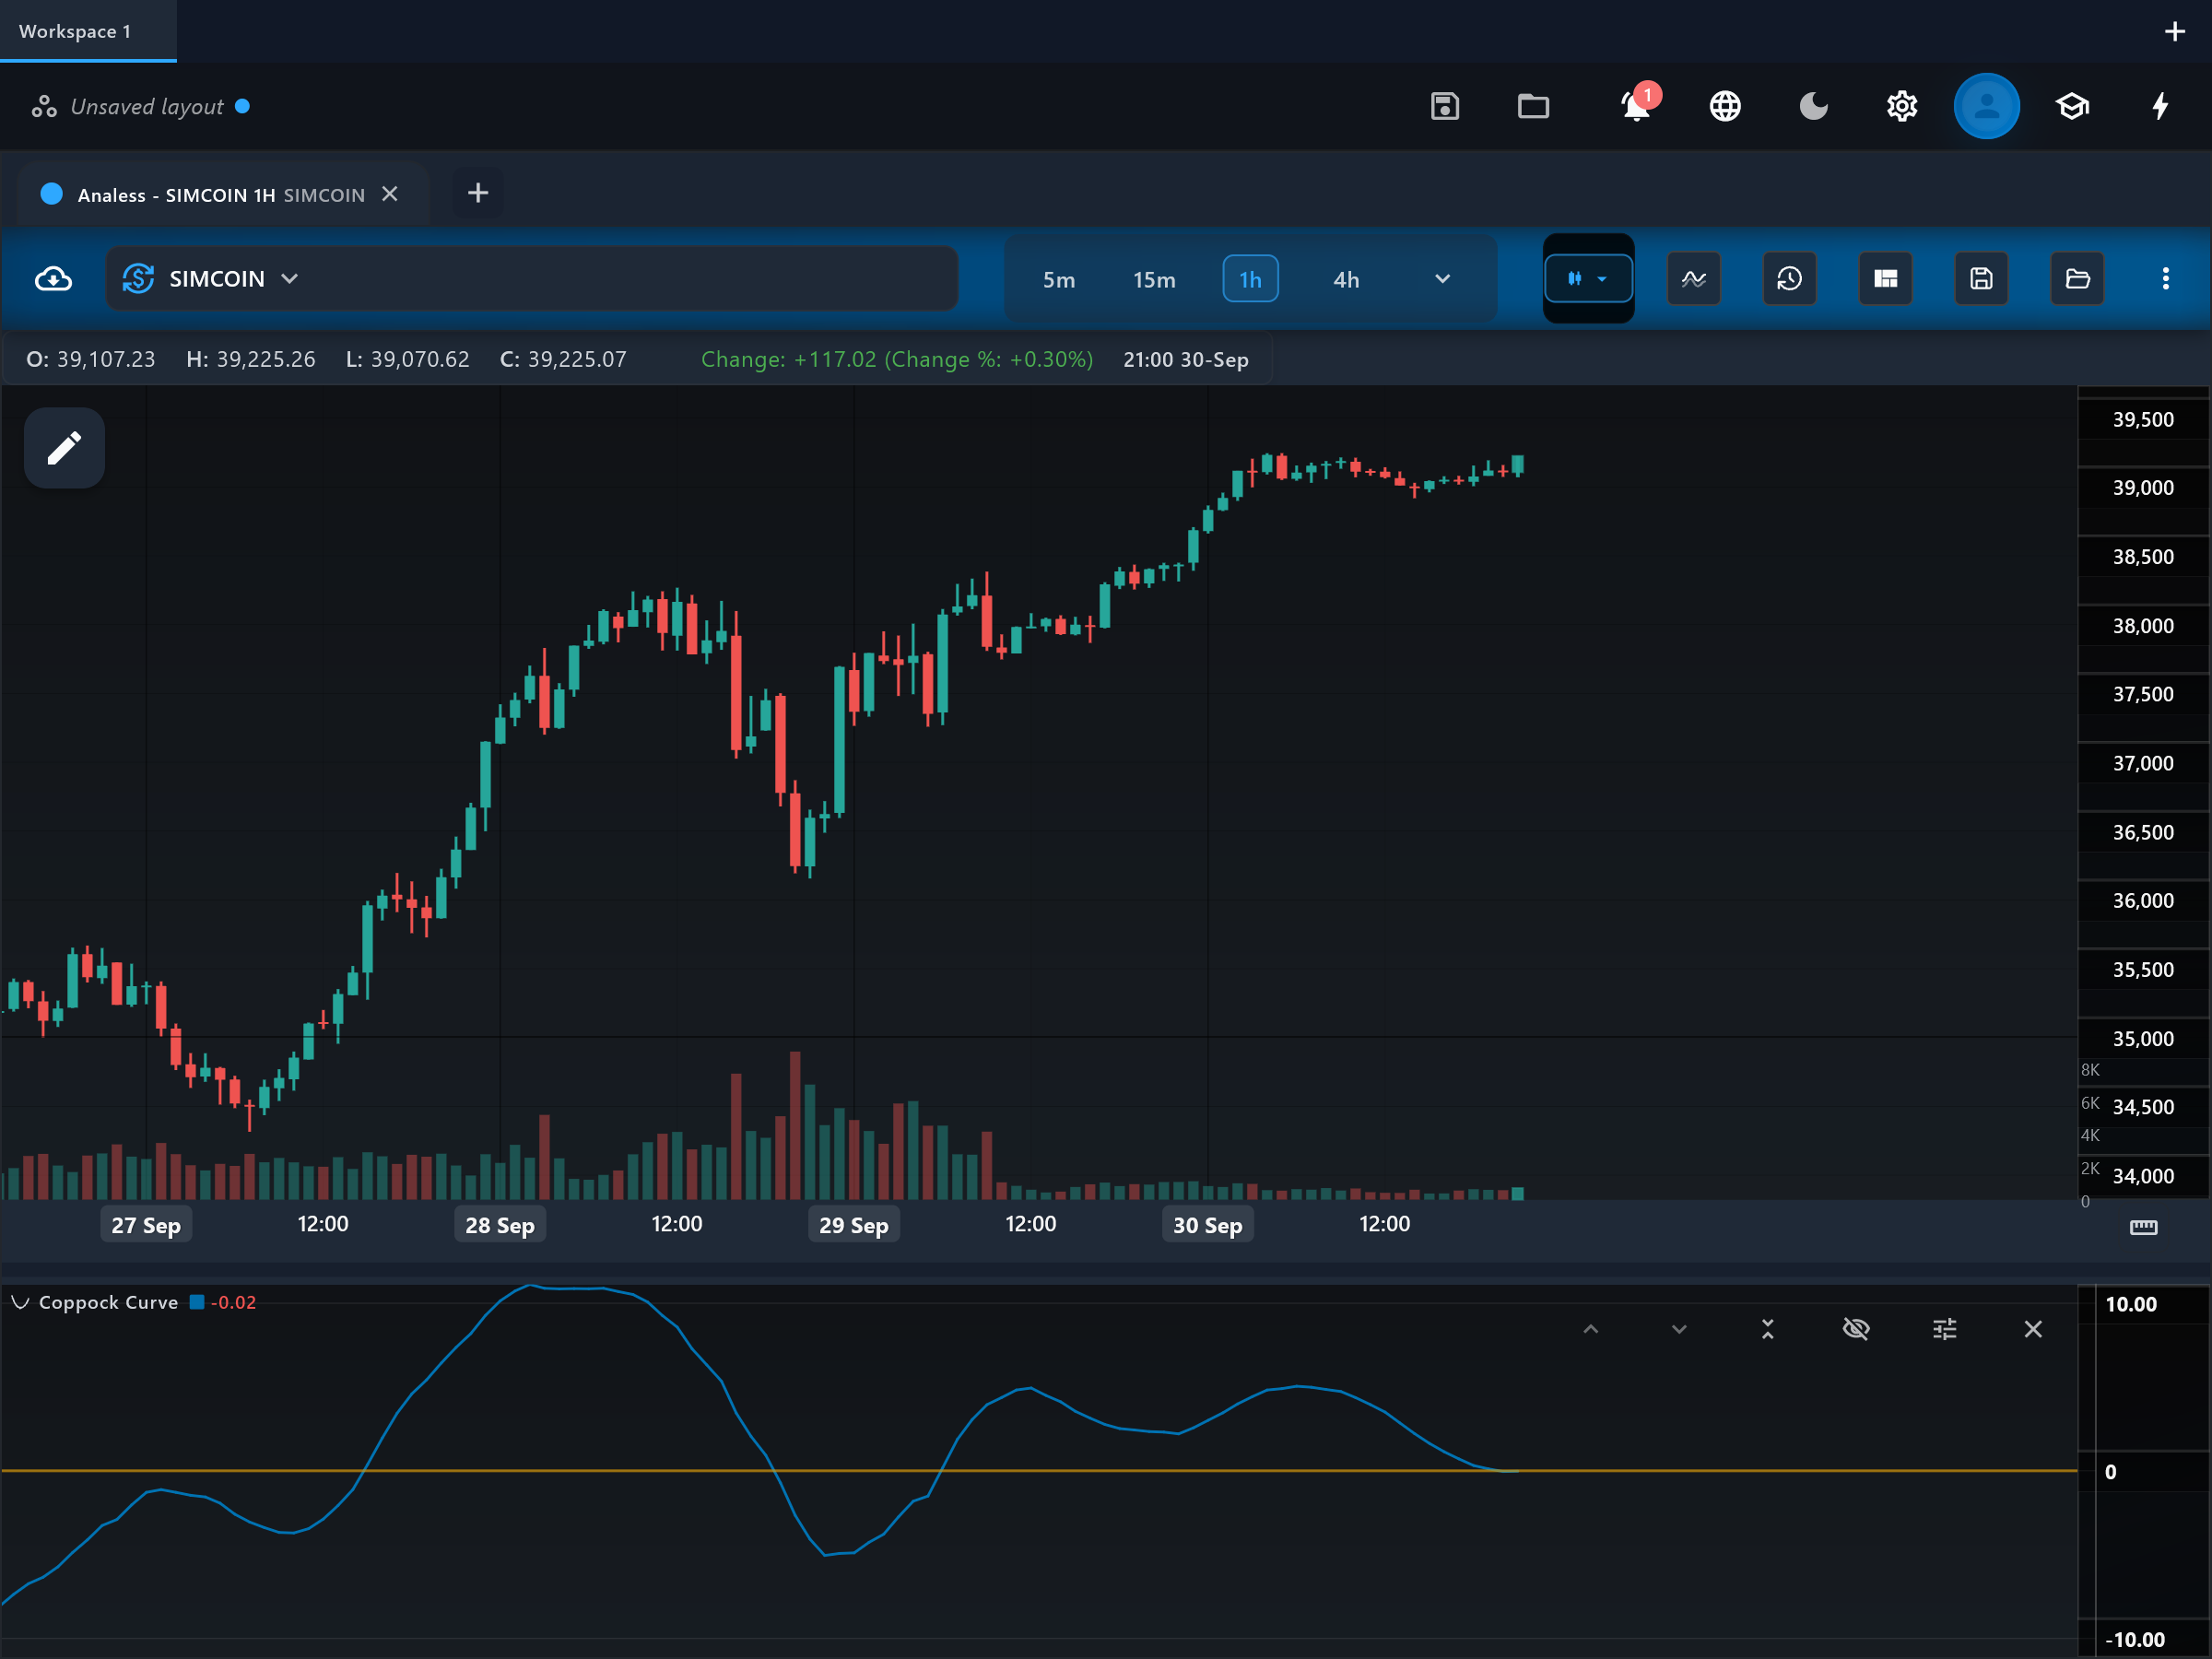
What it is
The Coppock Curve is a long-term momentum indicator created to identify major bottoms in stock market indexes. Edwin Coppock designed it in 1962 for monthly charts — reportedly inspired by the idea that markets, like people, need time to grieve after a loss — and it became famous for flagging durable bull-market starts. It is a smoothed sum of two rates of change, plotted as a single line around zero.
How it is calculated
Two rate-of-change values are computed on the chosen price source — a long ROC (default 14 periods) and a short ROC (default 11 periods) — then added together. That sum is smoothed with a weighted moving average (default 10 periods), which gives the most recent momentum readings the most influence. On the monthly charts it was designed for, the 14/11/10 defaults correspond to Coppock's original months-based settings.
How to read it
The "coppock" line oscillates around the flat "zero" level. The classic signal is not the zero cross itself but the turn: after the line has fallen below zero, an upturn — the first month the line rises from a trough — was the reading Coppock watched for in the index. The zero line separates broadly positive long-term momentum from negative. The indicator was designed only to find bottoms; Coppock never published a sell rule, and downturns above zero are a much weaker, unofficial reading.
What to look for
- Turning patternUpside
The "coppock" line turns upward from a trough below zero — the reading Coppock originally watched for on monthly index charts.
- Centre-line crossUpside
The line crosses above zero, confirming that long-term momentum has turned positive (a later, more conservative read than the trough upturn).
- Centre-line crossDownside
The line crosses below zero, showing long-term momentum has turned negative — often long after the price peak.
- DivergenceContext
Price makes a new extreme that the Coppock line does not match, suggesting the long-term move is losing momentum.
When to use it
The Coppock Curve is at home on monthly charts of broad stock indexes — that is what it was designed and validated for — and secondarily on weekly charts of indexes, ETFs, and large-cap stocks. It is a patient, big-picture tool for identifying the start of multi-year advances. It is not suited to intraday or even daily trading, to short-lived instruments without years of history, or as a sell-signal generator.
Works well with
Settings explained
longRocPeriod- Lookback of the longer rate of change. The default 14 matches Coppock's original 14 months. Raising it makes the curve respond to even longer cycles; lowering it shortens the indicator's horizon.
shortRocPeriod- Lookback of the shorter rate of change, default 11 (Coppock's 11 months). Keeping it close below the long period preserves the intended overlap of the two momentum windows.
wmaPeriod- Length of the weighted moving average applied to the ROC sum, default 10. A longer WMA gives a smoother, slower curve with later turns; a shorter one lets more noise through.
source- The price field the rates of change are computed on. Close is the standard choice for index work; other sources are rarely used with this indicator.
Limitations and common mistakes
- It was designed for monthly index data — applied to daily or intraday charts it becomes just another slow oscillator with no validated track record.
- Coppock defined only the upturn from below zero; there is no symmetric rule for tops, and improvised ones lag badly.
- Signals are rare and very late by short-term standards — that is by design, but it makes the tool useless for timing entries within a trend.
- Long lookbacks mean it needs years of history before the first meaningful reading.
References
- Origin: Edwin S. C. Coppock, 1962.
- Coppock curve — Wikipedia (opens in a new tab)
This page explains how an indicator is calculated and read. It describes past data, not what price will do next, and it is not a recommendation to trade. Read the disclaimers.
Try it in Analess
Add Coppock Curve to any chart, adjust its settings, and open this explainer from the indicator itself.