















Indicators · Momentum & oscillators
ROC
Rate of Change — the percent change in price over a set period.
Origin: Classical momentum construct—no single originator
- Best suited to
- Any market condition
- Responsiveness
- Leading
- Family
- Momentum & oscillators
What it is
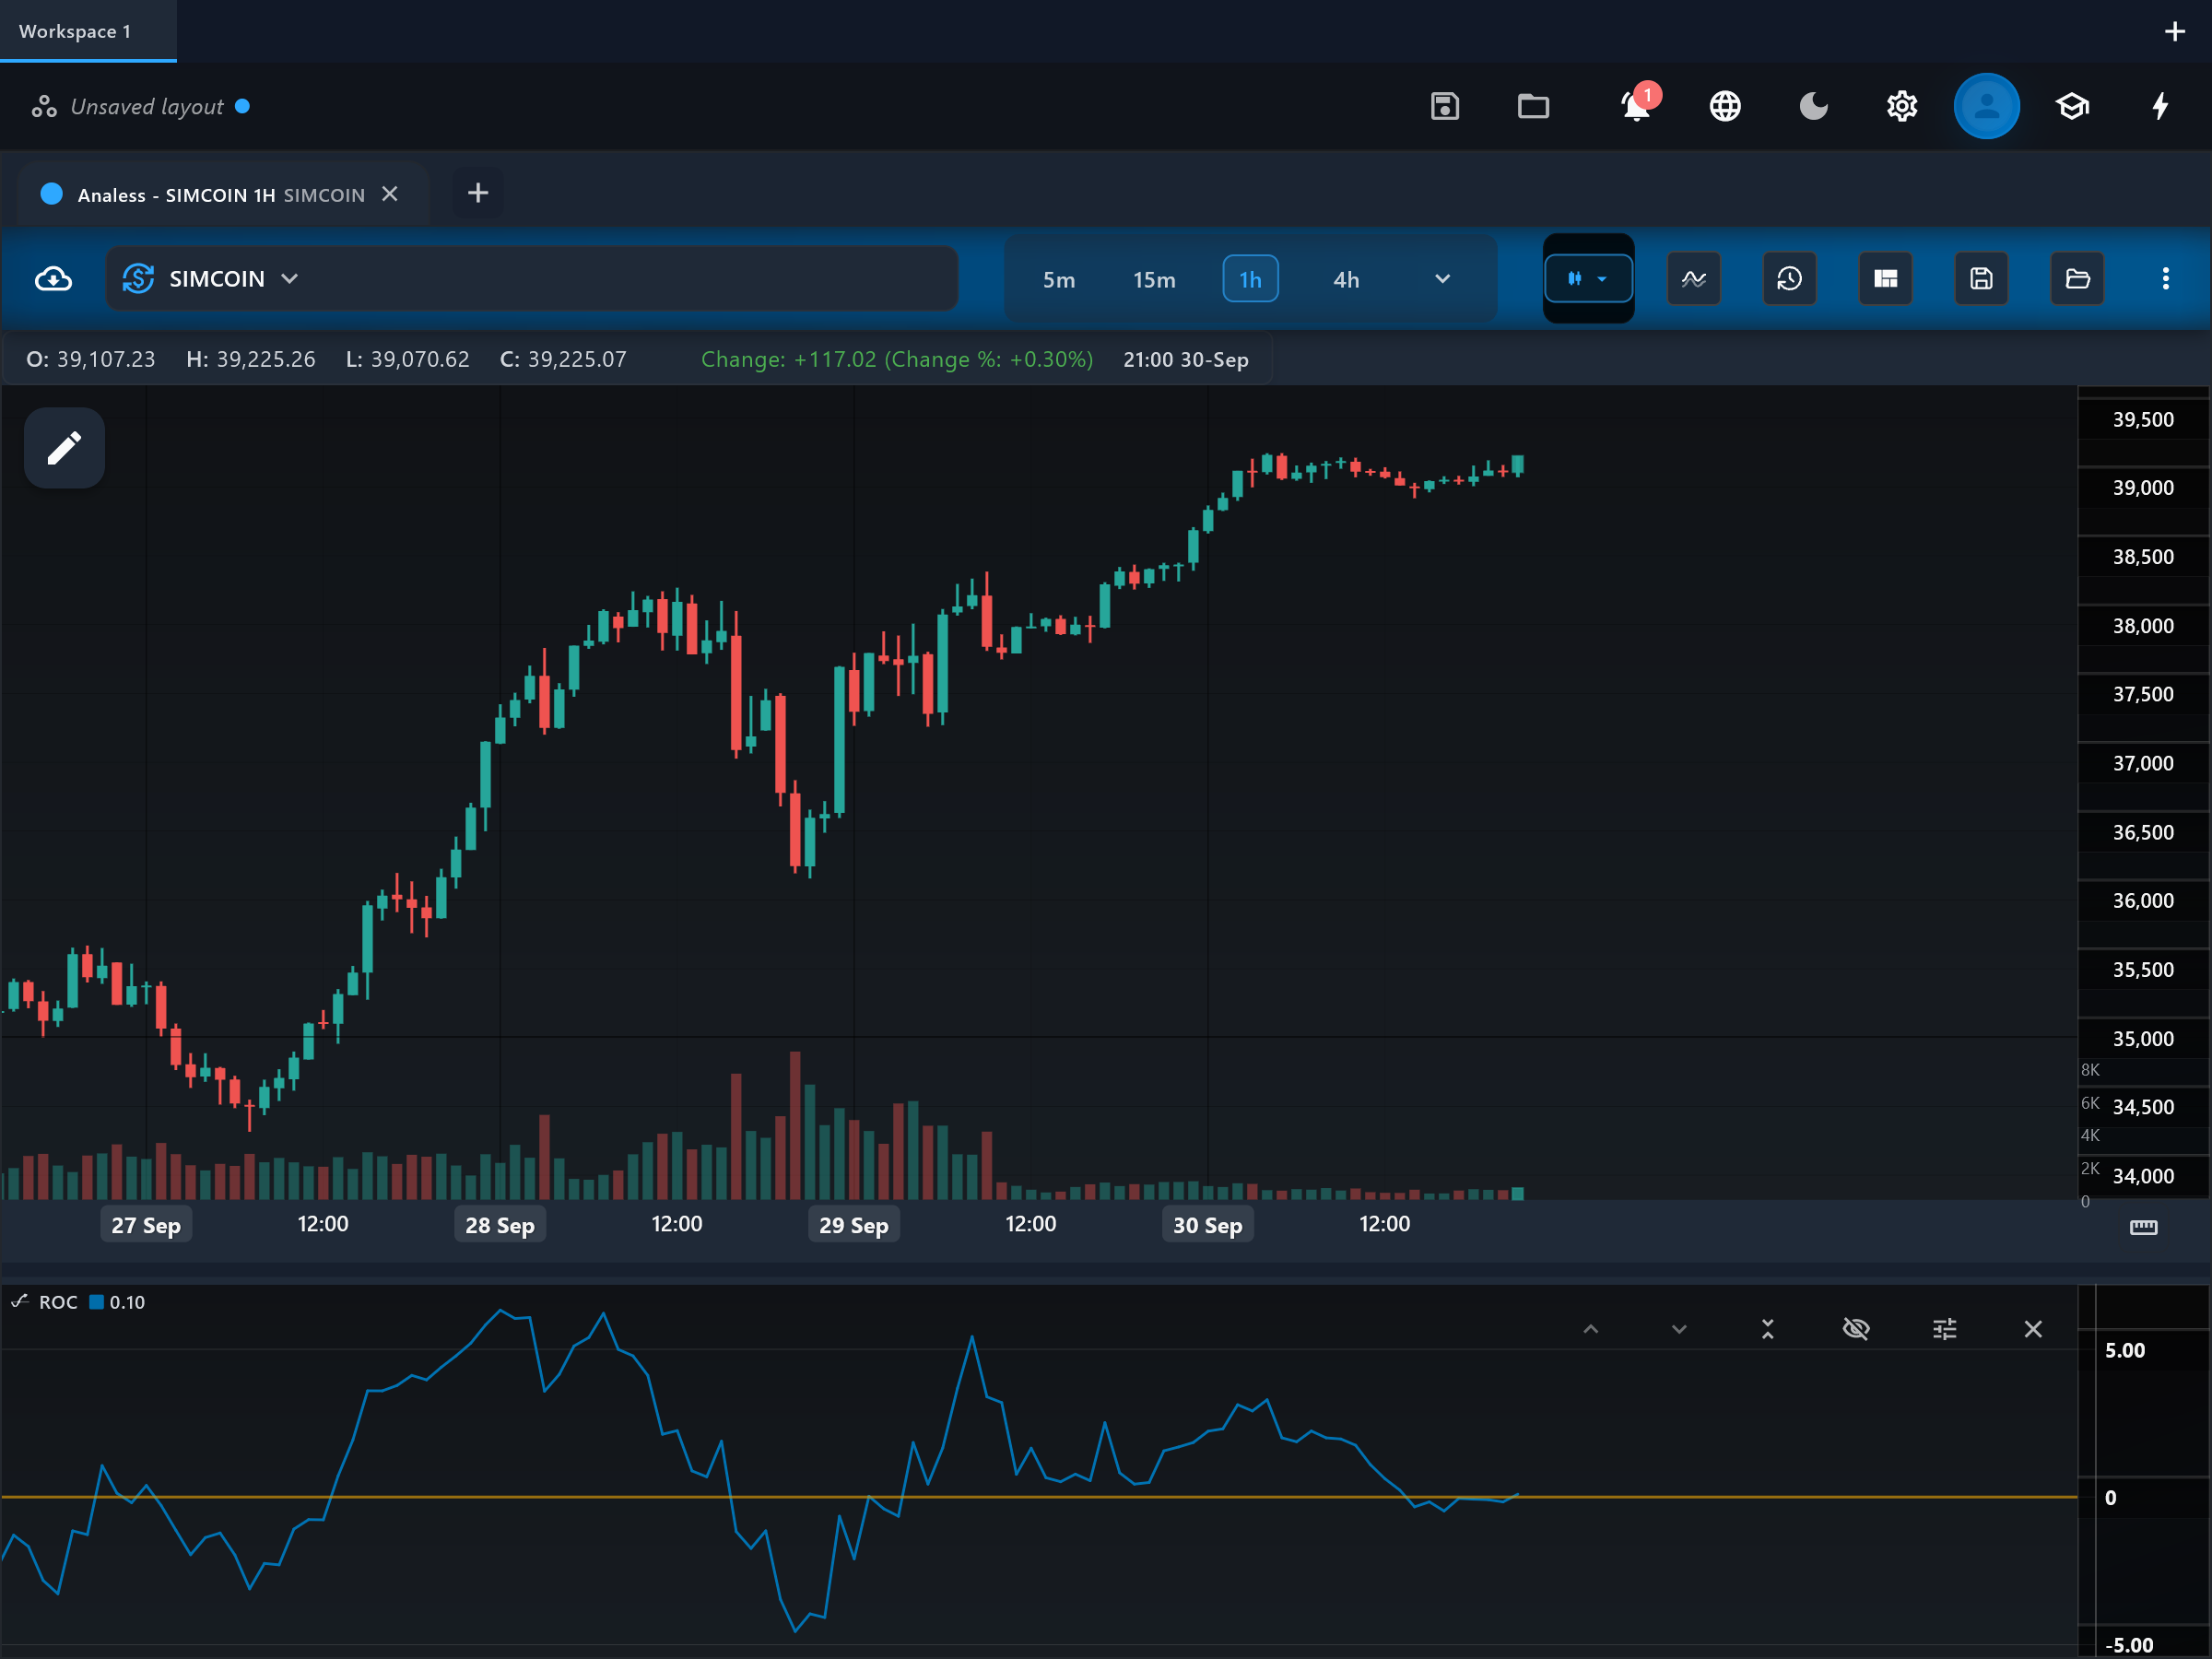
Rate of Change (ROC) is the percentage change of price over a fixed number of bars — the purest momentum measure. It answers a single question: how much, in percent, has price moved versus n bars ago? Positive means higher than then, negative means lower.
How it is calculated
ROC = 100 x (price - price n bars ago) / (price n bars ago), computed on the chosen source with n defaulting to 12. Because each value compares only two prices, an old spike leaving the window can move ROC even when the current price is quiet.
How to read it
The pane shows the "roc" line oscillating around the "zero" reference line. Above zero, price is up versus n bars ago; below zero, down. The slope matters as much as the sign: a rising ROC means momentum is building, a falling one means it is draining even while still positive. ROC is unbounded, so judge extremes against the symbol's own history rather than fixed levels.
What to look for
- Centre-line crossUpside
roc crossing above zero: price has turned positive versus n bars ago.
- Centre-line crossDownside
roc crossing below zero: price has turned negative versus n bars ago.
- DivergenceContext
Price making a new extreme while roc does not shows the percentage pace of the move is slowing.
- Overbought / oversoldContext
Readings that are extreme relative to the symbol's own ROC history flag stretched moves — but there is no universal level, since ROC is unbounded.
When to use it
ROC works anywhere as a simple momentum gauge and is a common building block for relative-strength comparisons across symbols. It is weakest in quiet, sideways markets, where it hovers near zero and crosses constantly, and its unbounded scale means "overbought" levels from one market or era do not transfer to another. In strong trends, zero-line crosses lag the actual turn by design.
Works well with
Settings explained
period- Default 12 — how many bars back the comparison price is. Short periods (5-10) track fast swings; long ones (50-200) approximate the medium and long-term trend.
source- Default close — the price series both ends of the comparison use.
Limitations and common mistakes
- Two-point comparison: a large bar dropping out of the window moves ROC without any new price action ("drop-off effect").
- Unbounded, so no fixed overbought/oversold levels exist.
- Whipsaws around zero in flat markets.
References
- Origin: Classical momentum construct—no single originator.
- Momentum (technical analysis) — Wikipedia (opens in a new tab)
This page explains how an indicator is calculated and read. It describes past data, not what price will do next, and it is not a recommendation to trade. Read the disclaimers.
Try it in Analess
Add ROC to any chart, adjust its settings, and open this explainer from the indicator itself.