















Indicators · Volume
Volume
The amount traded per bar — the raw participation behind price.
Origin: Raw market data—not a derived indicator
- Best suited to
- Any market condition
- Responsiveness
- Coincident
- Family
- Volume
What it is
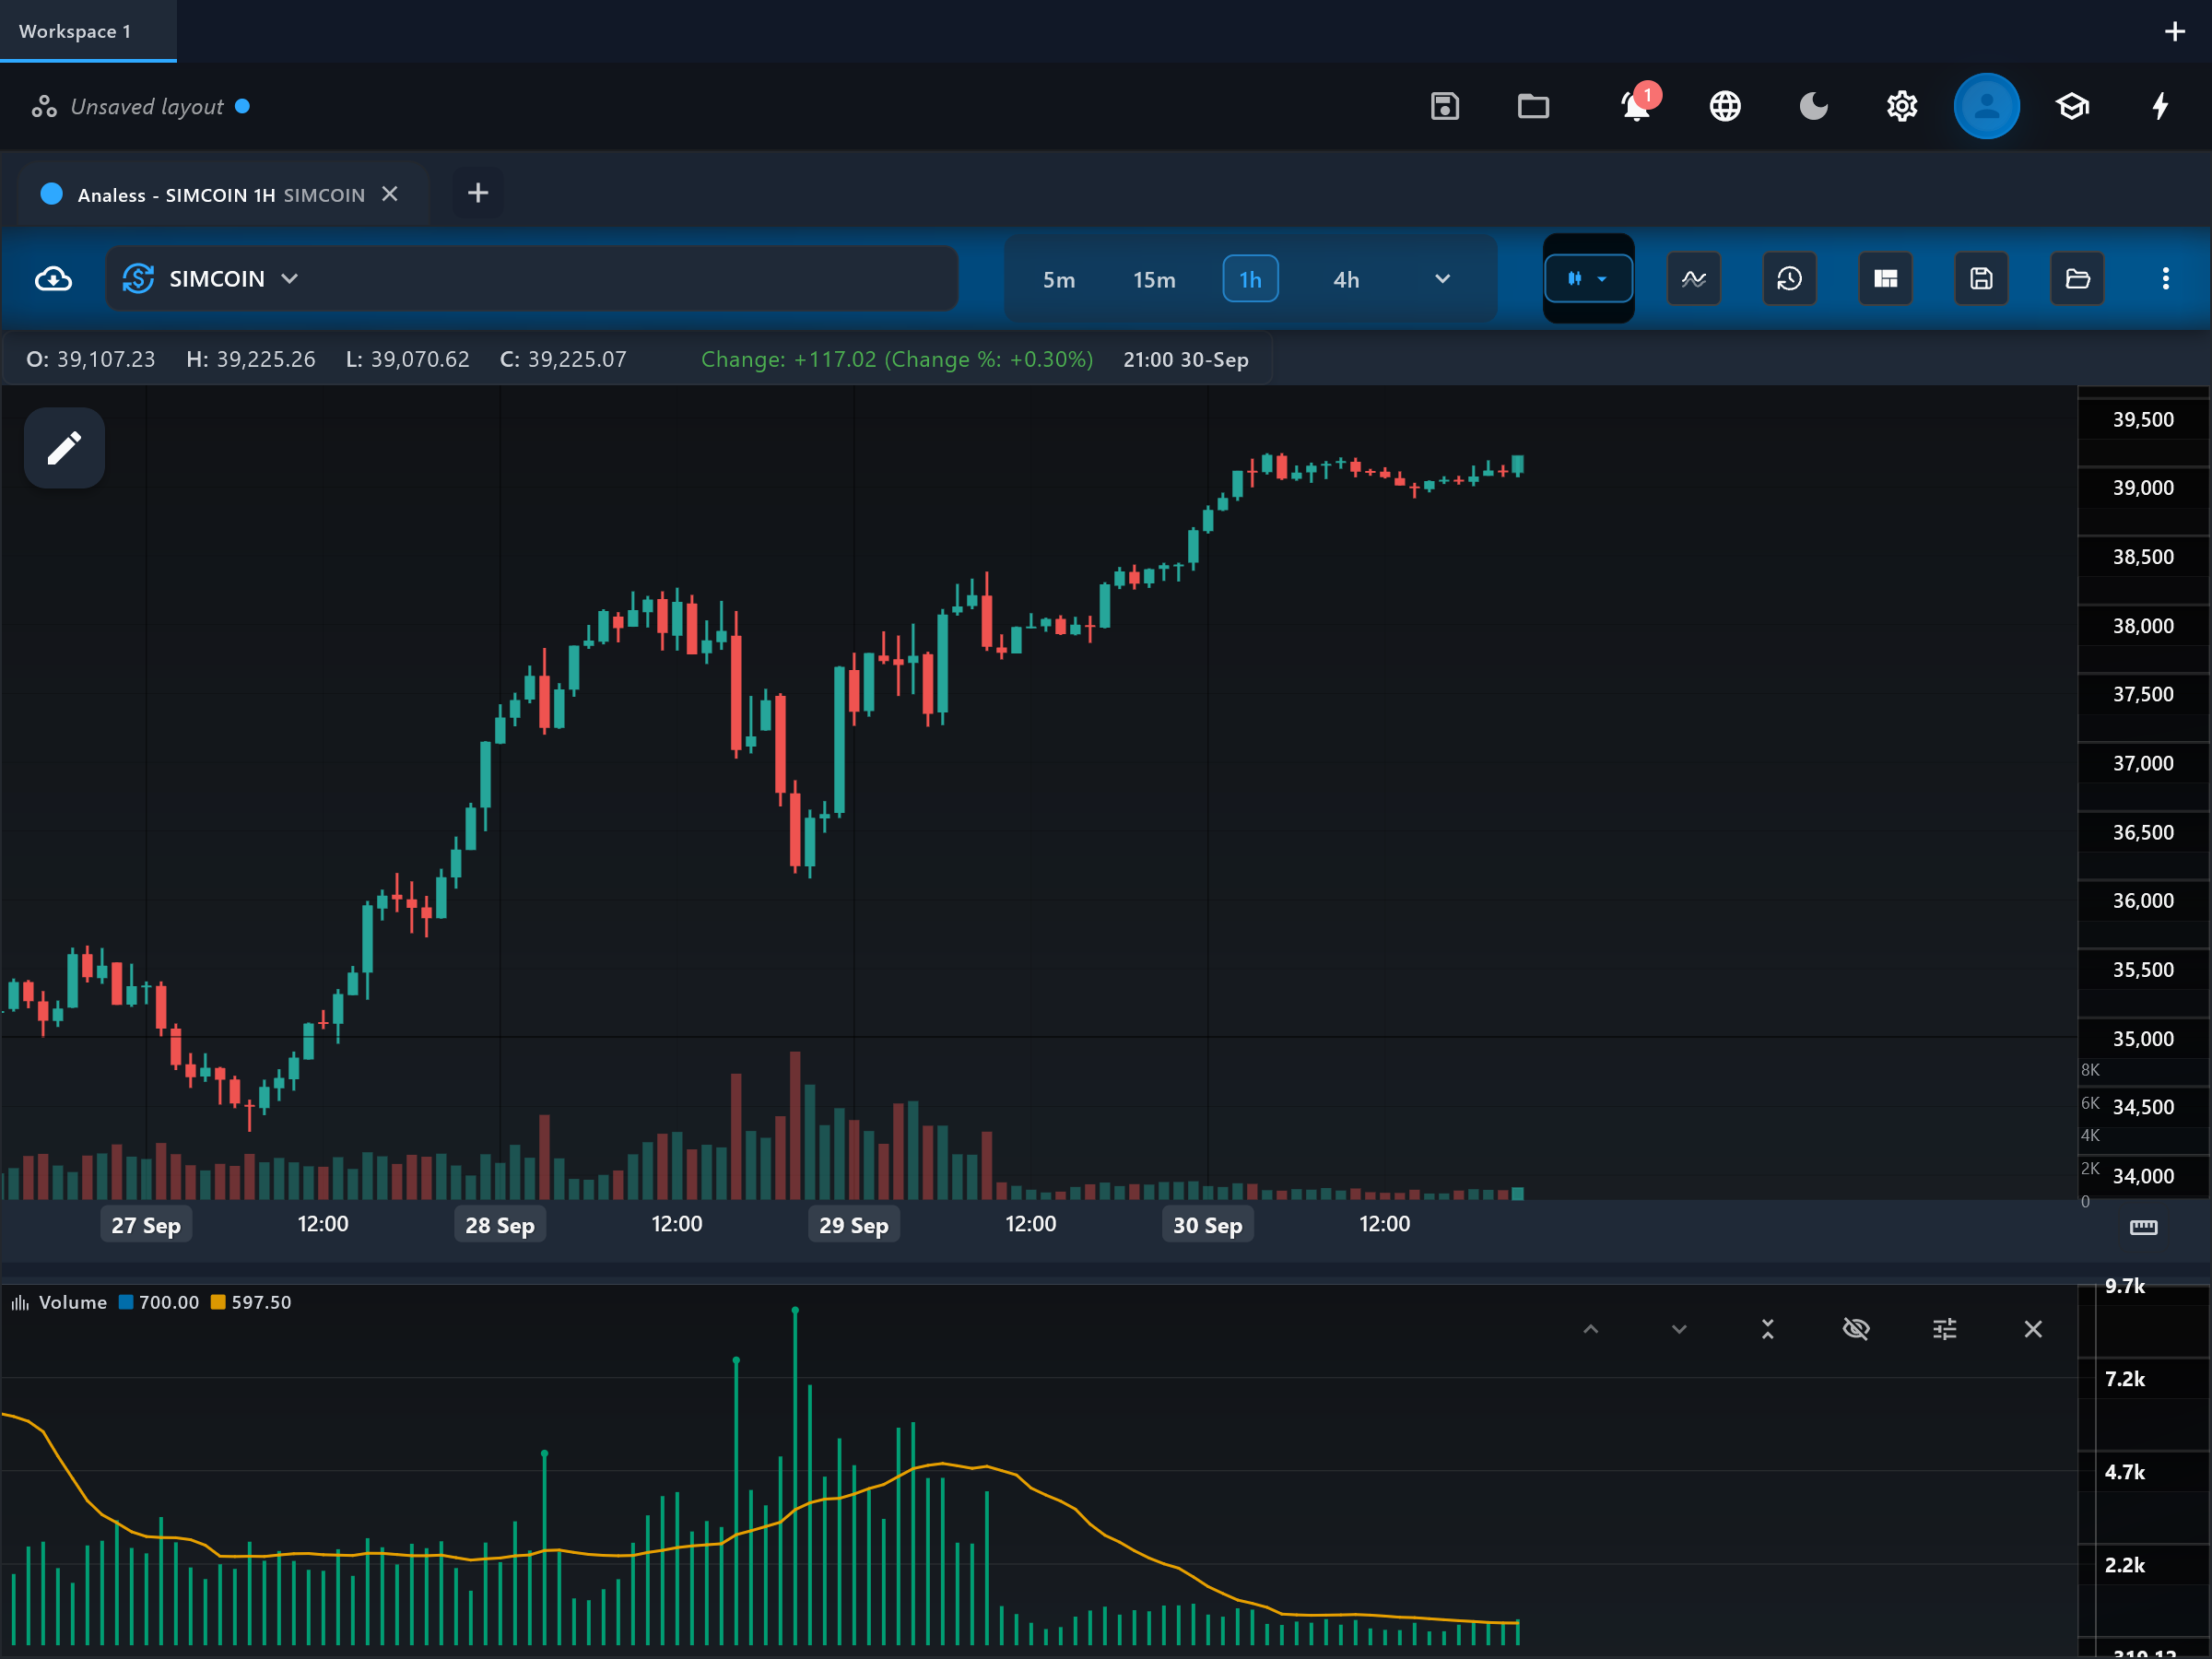
Volume shows how many units of an asset changed hands during each bar. It is the most direct measure of participation: high volume means many traders were active, low volume means few were. Most other volume indicators are built on top of this raw series.
How it is calculated
This app plots the raw per-bar volume as a histogram, overlays a simple moving average of volume over a configurable period, and marks "spike" bars whose volume exceeds that average multiplied by a threshold (by default, more than 2x the 20-bar average volume).
How to read it
The "volume_bars" histogram shows each bar's traded volume, so taller bars mean more activity. The "moving_average" line is the baseline of normal activity — compare each bar against it rather than against its neighbors. The "spike_indicator" dots flag bars whose volume is unusually large relative to that baseline; these often coincide with news, breakouts, or capitulation. Rising volume in the direction of a move is conventionally read as participation behind the move, while a rally on shrinking volume suggests fading interest.
What to look for
- ConfirmationContext
A price breakout accompanied by a volume bar well above the moving average is conventionally treated as better supported than a breakout on quiet volume.
- DivergenceContext
Price pushing to new highs while volume bars shrink below the moving average is a volume divergence — the move is being made with less and less participation.
- Range expansionContext
A spike_indicator dot marks an unusual burst of activity. After a long trend, an extreme spike can accompany exhaustion or climax; at a range boundary it often accompanies the breakout bar itself.
When to use it
Useful on any market where volume is genuinely reported, such as stocks and centralized crypto exchanges, and on any timeframe. Be careful with thin or illiquid symbols: a single modest order can print a "spike" that means nothing. On spot forex there is no central exchange, so the volume shown is tick volume (the number of price updates), which is only a rough proxy for real activity.
Works well with
Settings explained
maPeriod- Length of the simple moving average drawn over the volume bars (default 20). A shorter period tracks recent activity more tightly, making spikes rarer; a longer period gives a slower, steadier baseline and flags more bars as spikes.
spikeThreshold- The multiplier a bar must exceed (volume > average x threshold) to be marked as a spike (default 2.0). Raise it to only flag extreme bursts; lower it toward 1.0 to flag any above-average bar.
Limitations and common mistakes
- Volume alone says nothing about direction — a huge bar can be aggressive buying, aggressive selling, or both sides trading heavily at one level.
- Reported volume differs across venues; the same symbol on two exchanges can show very different histograms.
- On spot forex and CFDs the value is tick volume, not real traded size.
- Volume spikes cluster around scheduled events (opens, closes, news releases) and are not automatically meaningful.
References
- Origin: Raw market data—not a derived indicator.
- Volume (finance) — Wikipedia (opens in a new tab)
This page explains how an indicator is calculated and read. It describes past data, not what price will do next, and it is not a recommendation to trade. Read the disclaimers.
Try it in Analess
Add Volume to any chart, adjust its settings, and open this explainer from the indicator itself.