















Indicators · Momentum & oscillators
Fisher Transform
Reshapes price into a sharper, more symmetric oscillator to make turns clearer.
Origin: John F. Ehlers, 2002
- Best suited to
- Ranging markets
- Responsiveness
- Leading
- Family
- Momentum & oscillators
What it is
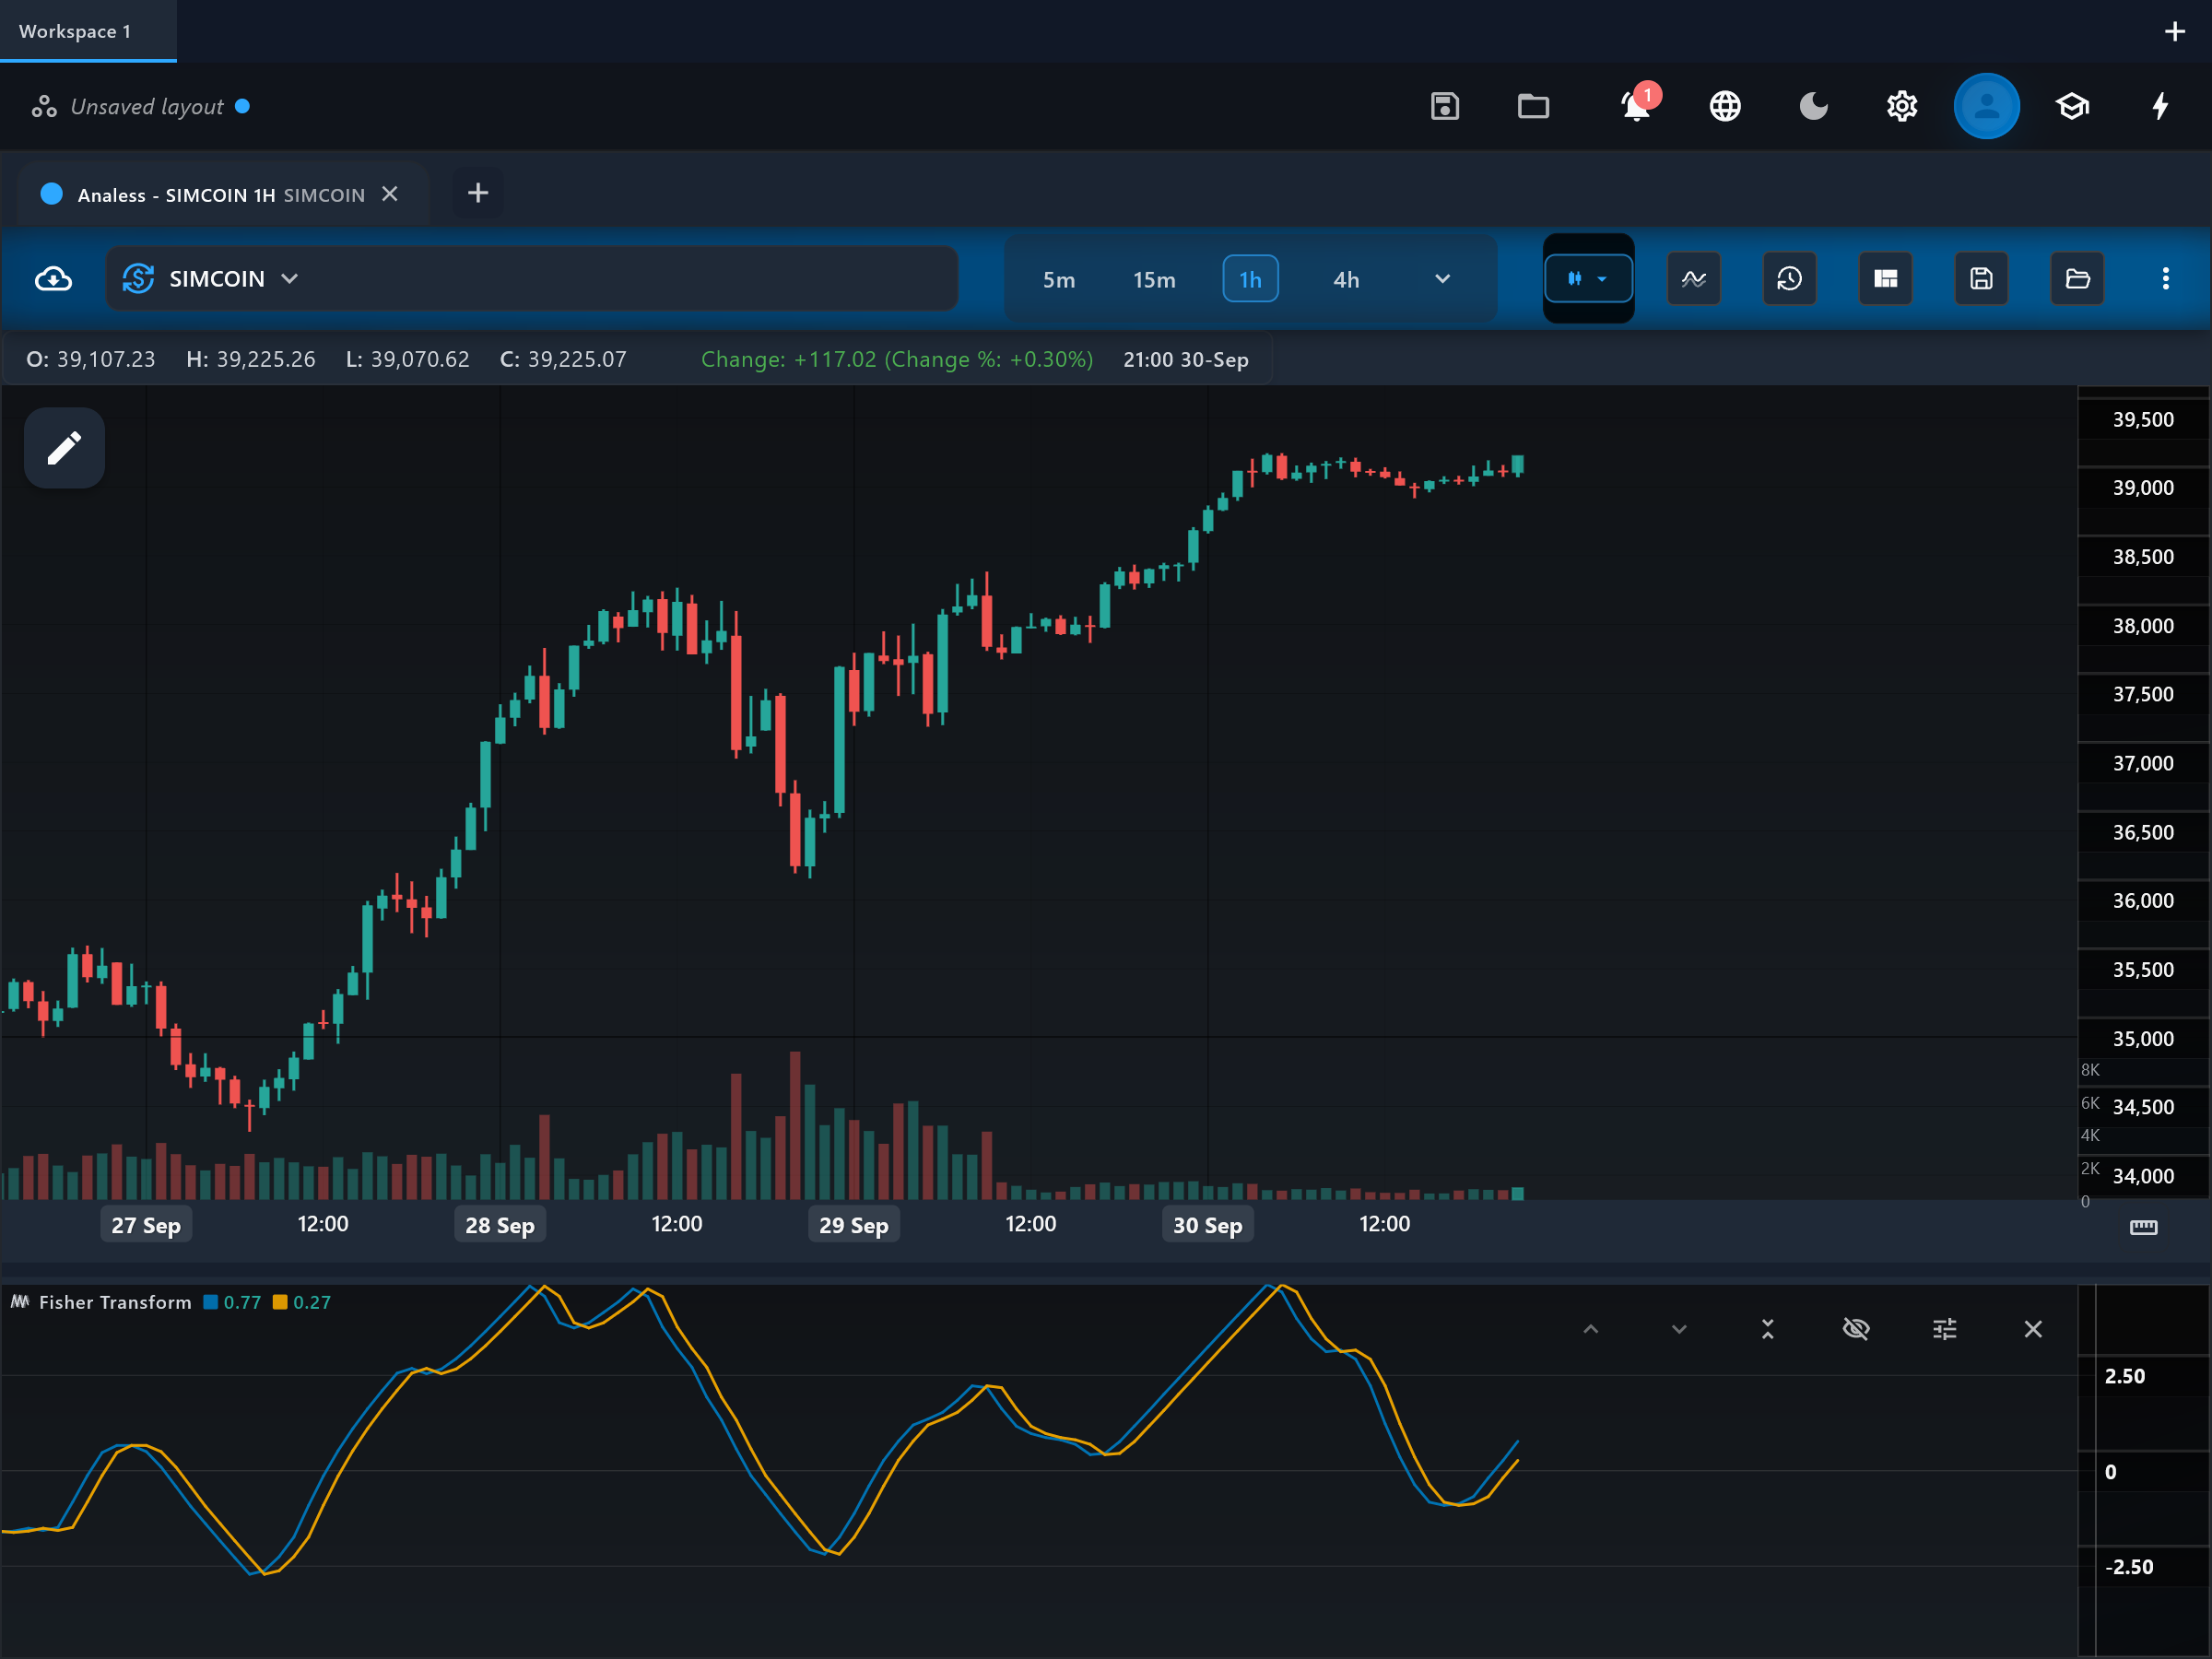
The Fisher Transform reshapes price data so that turning points stand out sharply. John Ehlers observed that price extremes are easier to detect if the data is transformed into something close to a bell-curve (Gaussian) distribution — the transform stretches the extremes into pronounced spikes. The result is a fast oscillator whose reversals tend to be unusually crisp and timely.
How it is calculated
The median price (high + low) / 2 is first normalized to a -1..+1 range using the highest and lowest values over the lookback (default 10 bars), with internal smoothing. The Fisher Transform function — 0.5 x ln((1 + x) / (1 - x)) — is then applied to that normalized value, expanding readings near the extremes into large output swings. A trigger line lags the Fisher line by a set number of bars (default 1, Ehlers' original), giving a built-in crossover reference.
How to read it
Two lines share the pane: "fisher" (the transformed value) and "trigger" (the same line delayed). Sharp peaks and troughs in the "fisher" line map closely to price turning points — that is the transform's purpose. Crosses of "fisher" through "trigger" are the standard timing signal, and the magnitude of the reading matters: values beyond roughly +1.5 or -1.5 mark statistically stretched extremes where reversals become more likely. Zero-line position gives a rough bullish/bearish bias.
What to look for
- Signal-line crossUpside
The "fisher" line crosses above the "trigger" line, especially after a deep negative extreme — the classic Fisher buy timing.
- Signal-line crossDownside
The "fisher" line crosses below the "trigger" line after a high positive extreme.
- Overbought / oversoldContext
Readings beyond about +1.5/-1.5 (and especially +2/-2) mark rare, stretched extremes where a turn is statistically favoured.
- Centre-line crossContext
Fisher crossing zero shifts the short-term bias between bullish and bearish — a secondary, confirming read.
When to use it
The Fisher Transform excels on instruments that swing within ranges or rhythmic cycles — FX pairs, index futures, and liquid crypto on intraday to daily bars — where its sharp extremes pinpoint swing turns. It is a favourite for timing entries that another tool has already justified. In strong, persistent trends it is dangerous on its own: it will flag extreme after extreme against the trend while price keeps going.
Works well with
Settings explained
period- The lookback used to normalize median price between its highest high and lowest low. The default 10 is Ehlers' published value. A shorter period makes extremes fire more often; a longer one produces fewer, better-separated spikes.
triggerPeriod- How many bars the trigger line lags the Fisher line; 1 is Ehlers' original. Raising it widens the gap between the lines so crosses come later but whipsaw less.
Limitations and common mistakes
- In trending markets it repeatedly signals reversals that never come — it needs a trend filter alongside it.
- The transform amplifies extremes by design, which makes readings look more dramatic (and more certain) than the underlying data justifies.
- The default 1-bar trigger produces very frequent crosses; most of them are noise unless filtered by the extreme-level context.
References
- Origin: John F. Ehlers, 2002.
- Fisher transformation — Wikipedia (opens in a new tab)
This page explains how an indicator is calculated and read. It describes past data, not what price will do next, and it is not a recommendation to trade. Read the disclaimers.
Try it in Analess
Add Fisher Transform to any chart, adjust its settings, and open this explainer from the indicator itself.