















Indicators · Momentum & oscillators
Momentum
The simplest measure — how far price has moved over a set number of bars.
Origin: Classical momentum construct—no single originator
- Best suited to
- Any market condition
- Responsiveness
- Leading
- Family
- Momentum & oscillators
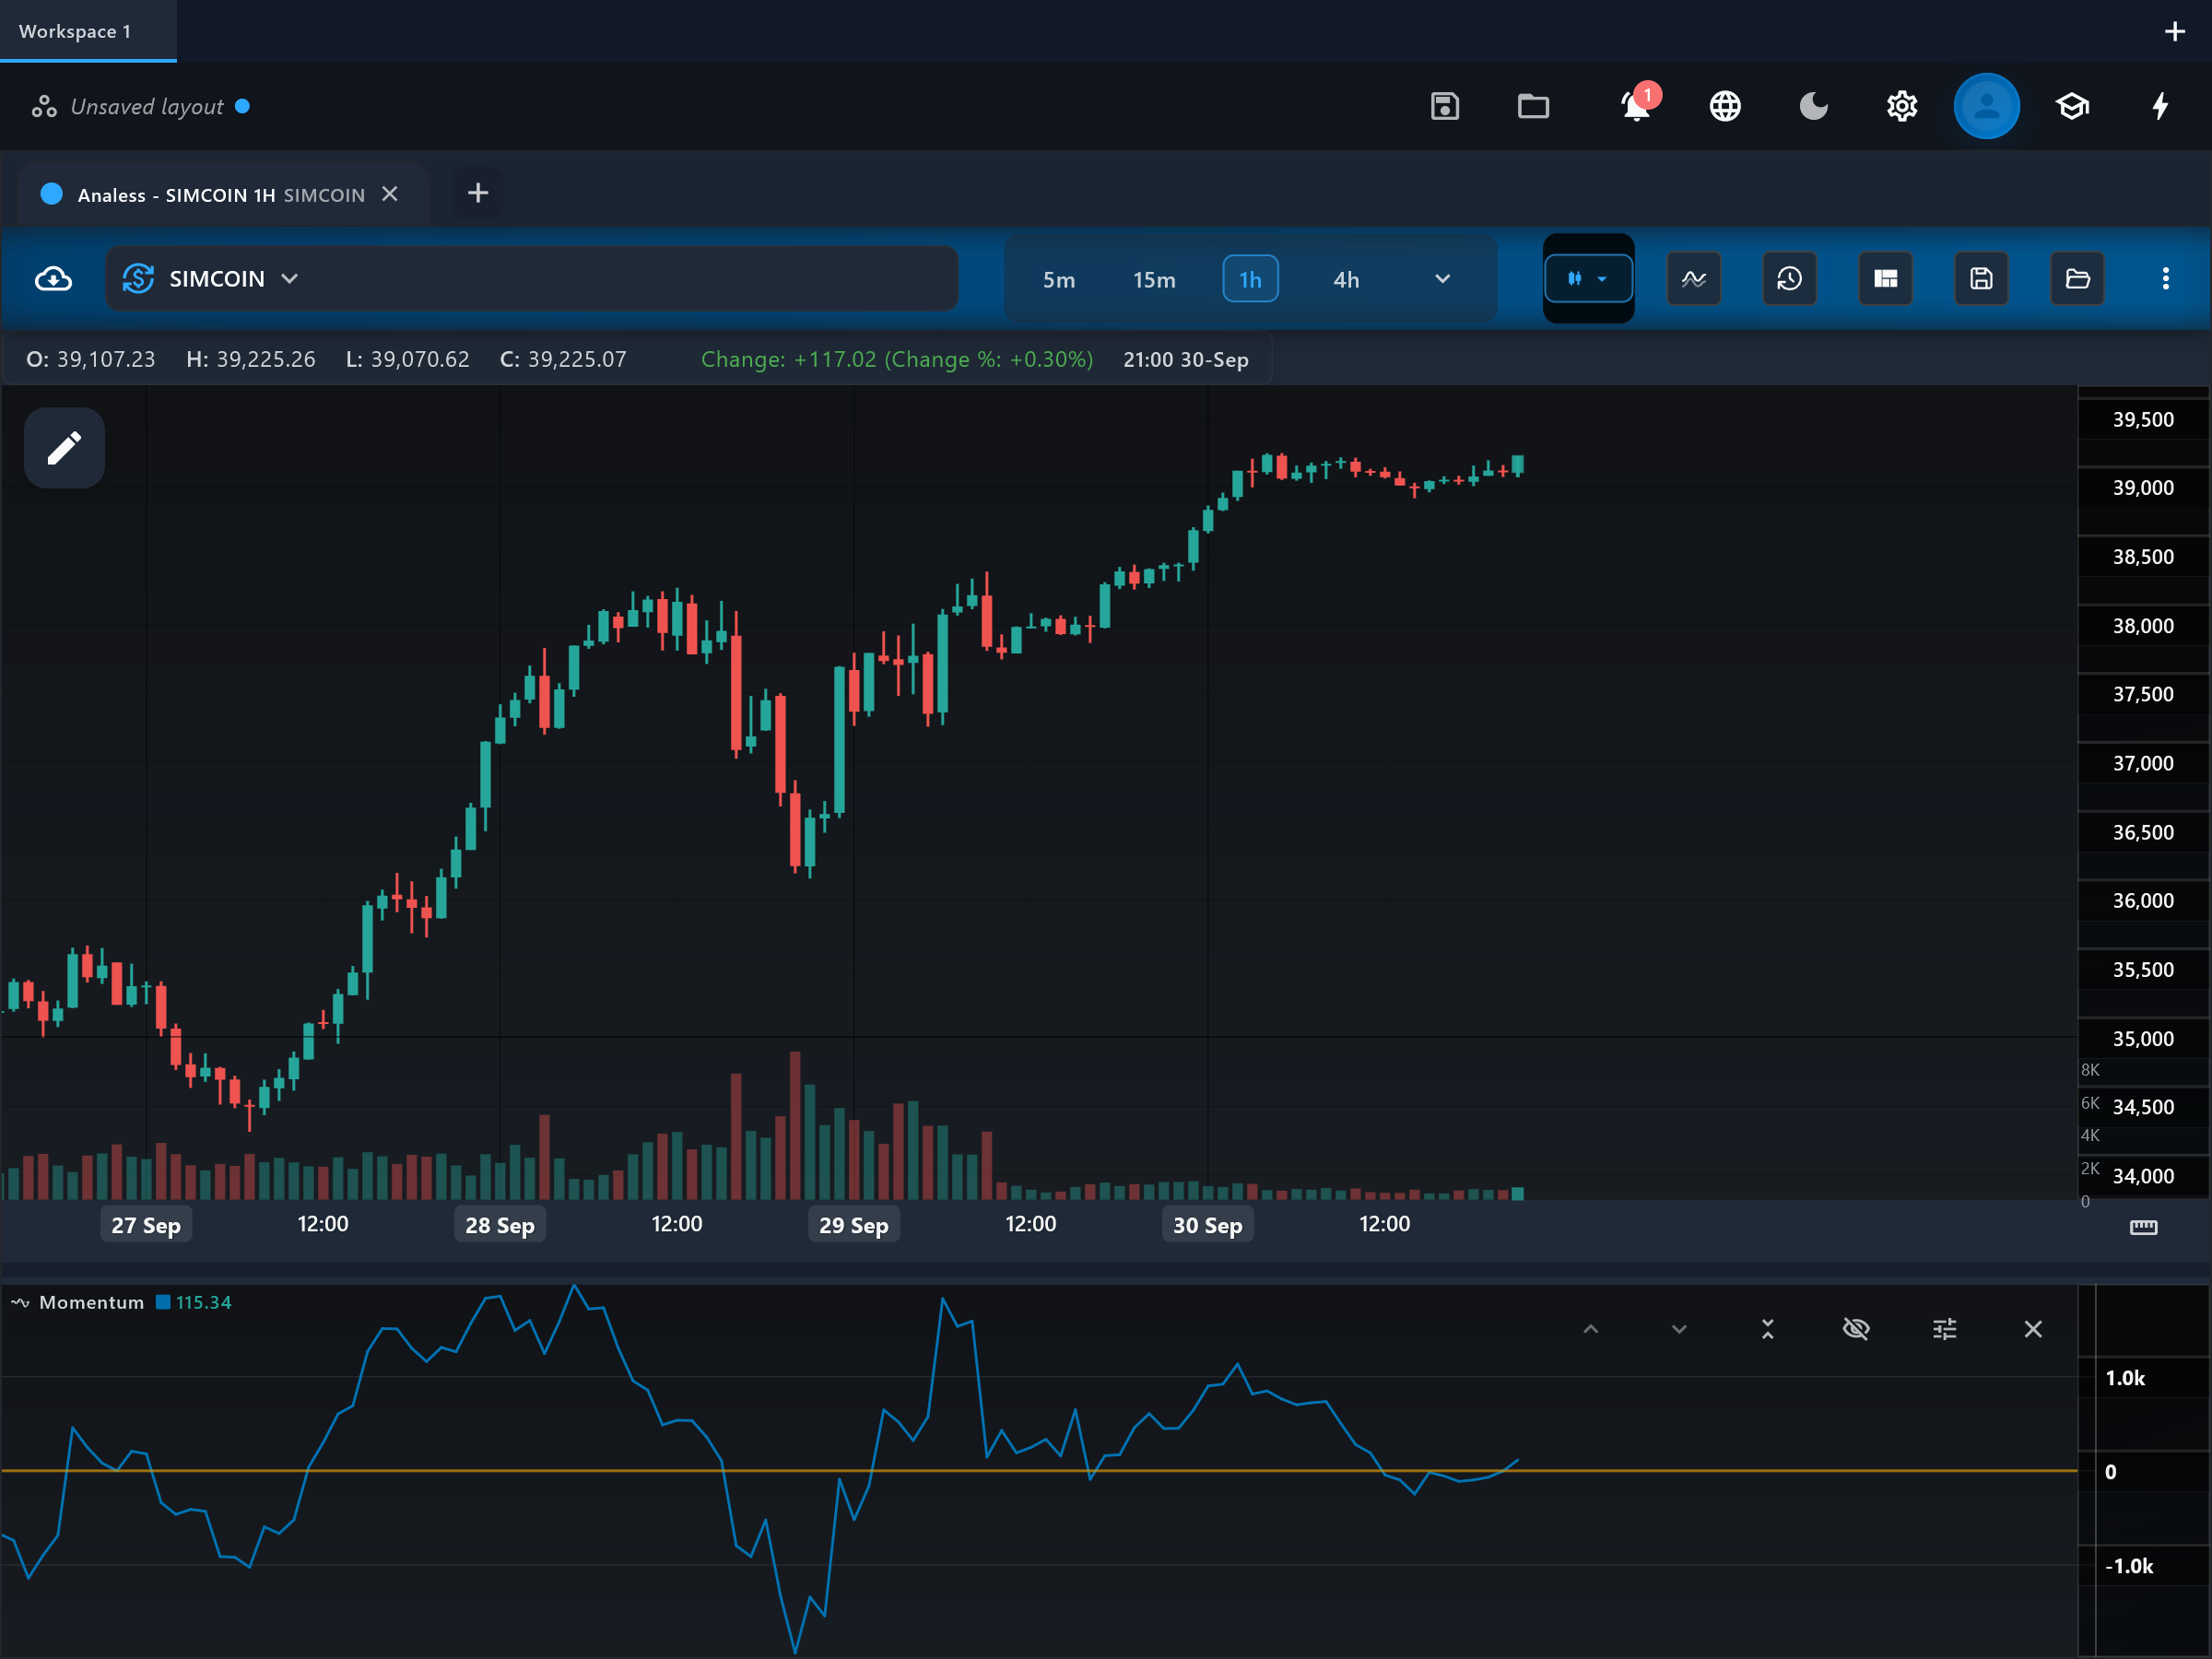
What it is
The Momentum indicator is the raw price difference between now and n bars ago, in the symbol's own price units. It is ROC without the percentage: the simplest possible measure of how fast price is changing, positive when price is above its past value and negative when below.
How it is calculated
Momentum = price - price n bars ago, computed on the chosen source with n defaulting to 10. Rising momentum means each bar's change versus n bars back is growing; falling momentum means the move is decelerating, even if price itself is still rising.
How to read it
The pane shows the "momentum" line around the "zero" reference line. Above zero, price exceeds its value n bars ago; below zero it is under it. Because the units are absolute price, the magnitude depends on the symbol — a momentum of 50 means nothing without knowing the price level — so compare readings only within the same chart. The slope of the line signals acceleration or deceleration ahead of a zero cross.
What to look for
- Centre-line crossUpside
momentum crossing above zero: price has moved above where it was n bars ago.
- Centre-line crossDownside
momentum crossing below zero: price has fallen below where it was n bars ago.
- DivergenceContext
Price extending to new extremes while momentum flattens or reverses signals deceleration before a possible turn.
When to use it
Momentum is a teaching-grade, general-purpose gauge that works on any market with a persistent swing structure, and its deceleration warnings are useful in trends. In quiet ranges it chops around zero with little value. Because its scale is the symbol's price units, avoid comparing values across symbols or across long periods where the price level changed substantially — use ROC or PPO for that.
Works well with
Settings explained
period- Default 10 — how many bars back the reference price is. Shorter periods make the line twitchier; longer ones track broader swings.
source- Default close — the price series used for both today's value and the n-bars-ago value.
Limitations and common mistakes
- Absolute price units: readings are not comparable across symbols or across large changes in price level.
- Same drop-off effect as ROC — an old bar leaving the window moves the value.
- No smoothing and no bounds, so no standard overbought/oversold zones exist.
References
- Origin: Classical momentum construct—no single originator.
- Momentum (technical analysis) — Wikipedia (opens in a new tab)
This page explains how an indicator is calculated and read. It describes past data, not what price will do next, and it is not a recommendation to trade. Read the disclaimers.
Try it in Analess
Add Momentum to any chart, adjust its settings, and open this explainer from the indicator itself.