















Indicators · Volume
Negative Volume Index
Focuses on days when volume falls, on the idea that they reflect informed activity.
Origin: Paul Dysart, 1930s; popularized by Norman Fosback, 1976
- Best suited to
- Trending markets
- Responsiveness
- Lagging
- Family
- Volume
What it is
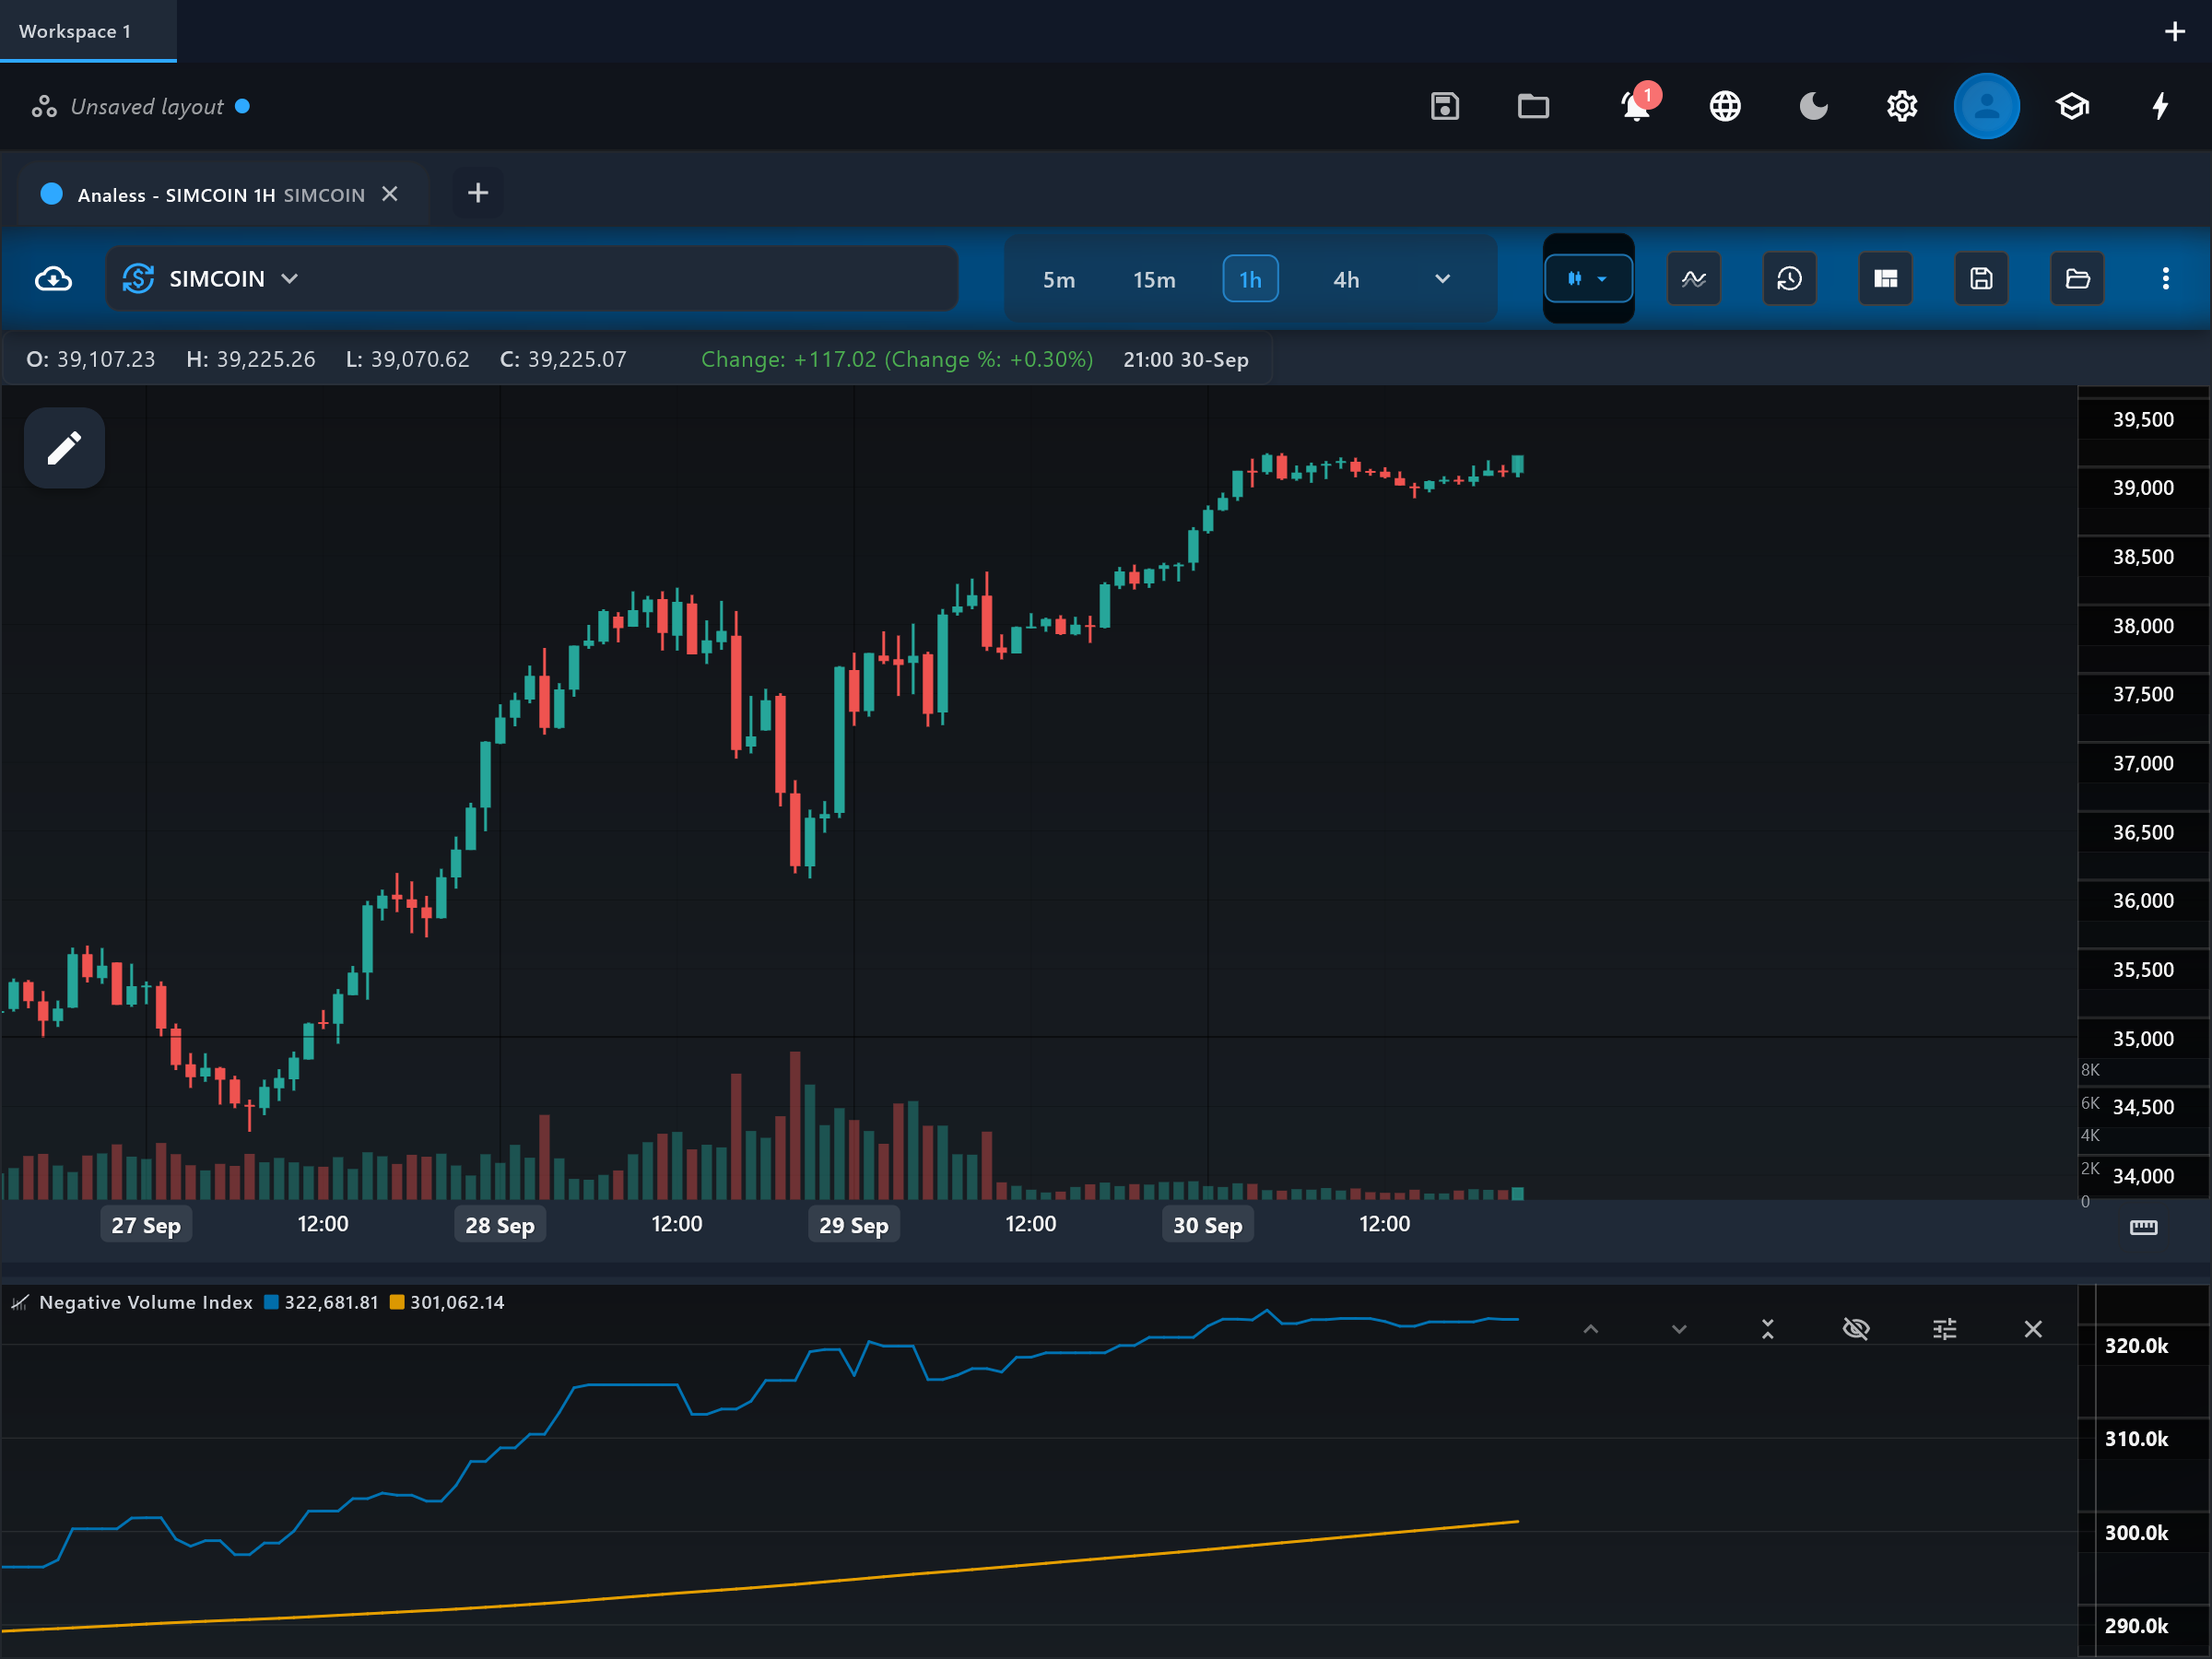
The Negative Volume Index (NVI) is a cumulative line that updates only on bars where volume fell versus the previous bar. The tradition behind it, articulated by Norman Fosback, holds that quiet, low-volume sessions reveal what informed ("smart money") investors are doing while the crowd is absent — a folk hypothesis worth knowing, not an established fact.
How it is calculated
Starting from a base value, this app adds the bar's percentage price change to the running NVI only when the bar's volume is lower than the previous bar's; on higher-volume bars the line stays flat. A long simple moving average (default 255 bars, roughly one trading year on dailies) is drawn as the signal line.
How to read it
The "nvi" line only moves on declining-volume bars, so it steps and pauses rather than flowing. Its position versus the "signal" average is the classic read: Fosback's studies claimed that when NVI is above its one-year average, the odds of a bull market are high — presented here as his historical finding, not a guarantee. A rising nvi means prices have tended to rise on quiet days, which the tradition interprets as patient accumulation; a falling nvi means quiet days lean lower.
What to look for
- Trend filterUpside
NVI holding above its long signal average is Fosback's classic bullish condition — quiet-day price action has been net positive over the past year.
- Trend filterDownside
NVI below its signal average marks the traditionally weaker regime, where quiet days have leaned negative.
- Signal-line crossContext
Crosses of nvi through its signal line mark regime changes in quiet-day behavior; with a 255-bar average these are rare, slow signals.
When to use it
Designed for broad stock indices and large-cap equities on daily charts, where the quiet-day/busy-day distinction has some economic texture. It is a slow regime tool, not a trade-timing tool. It is poorly suited to thin symbols (volume comparisons between adjacent bars become noise) and to spot forex, where tick volume makes the up/down-volume distinction unreliable.
Works well with
Settings explained
signalPeriod- Length of the simple moving average over the NVI line (default 255 — about one year of daily bars, matching Fosback's original test). Shorter periods make the regime-filter flip more often; on intraday charts consider what span of bars a "year-like" baseline should cover.
Limitations and common mistakes
- The "smart money trades on quiet days" premise is a tradition from 20th-century equity-market studies, not a verified law — treat NVI's story as one hypothesis.
- With a 255-bar signal it says nothing useful until long history has loaded, and signals are rare.
- The volume comparison is bar-to-bar, so holidays, half-days, and venue outages create spurious "quiet" days.
- It was designed for daily index data; its meaning on intraday or crypto charts is untested tradition at best.
References
- Origin: Paul Dysart, 1930s; popularized by Norman Fosback, 1976.
- Negative volume index — Wikipedia (opens in a new tab)
This page explains how an indicator is calculated and read. It describes past data, not what price will do next, and it is not a recommendation to trade. Read the disclaimers.
Try it in Analess
Add Negative Volume Index to any chart, adjust its settings, and open this explainer from the indicator itself.