















Indicators · Volume
Positive Volume Index
Focuses on days when volume rises to track crowd participation.
Origin: Paul Dysart, 1930s; popularized by Norman Fosback, 1976
- Best suited to
- Trending markets
- Responsiveness
- Lagging
- Family
- Volume
What it is
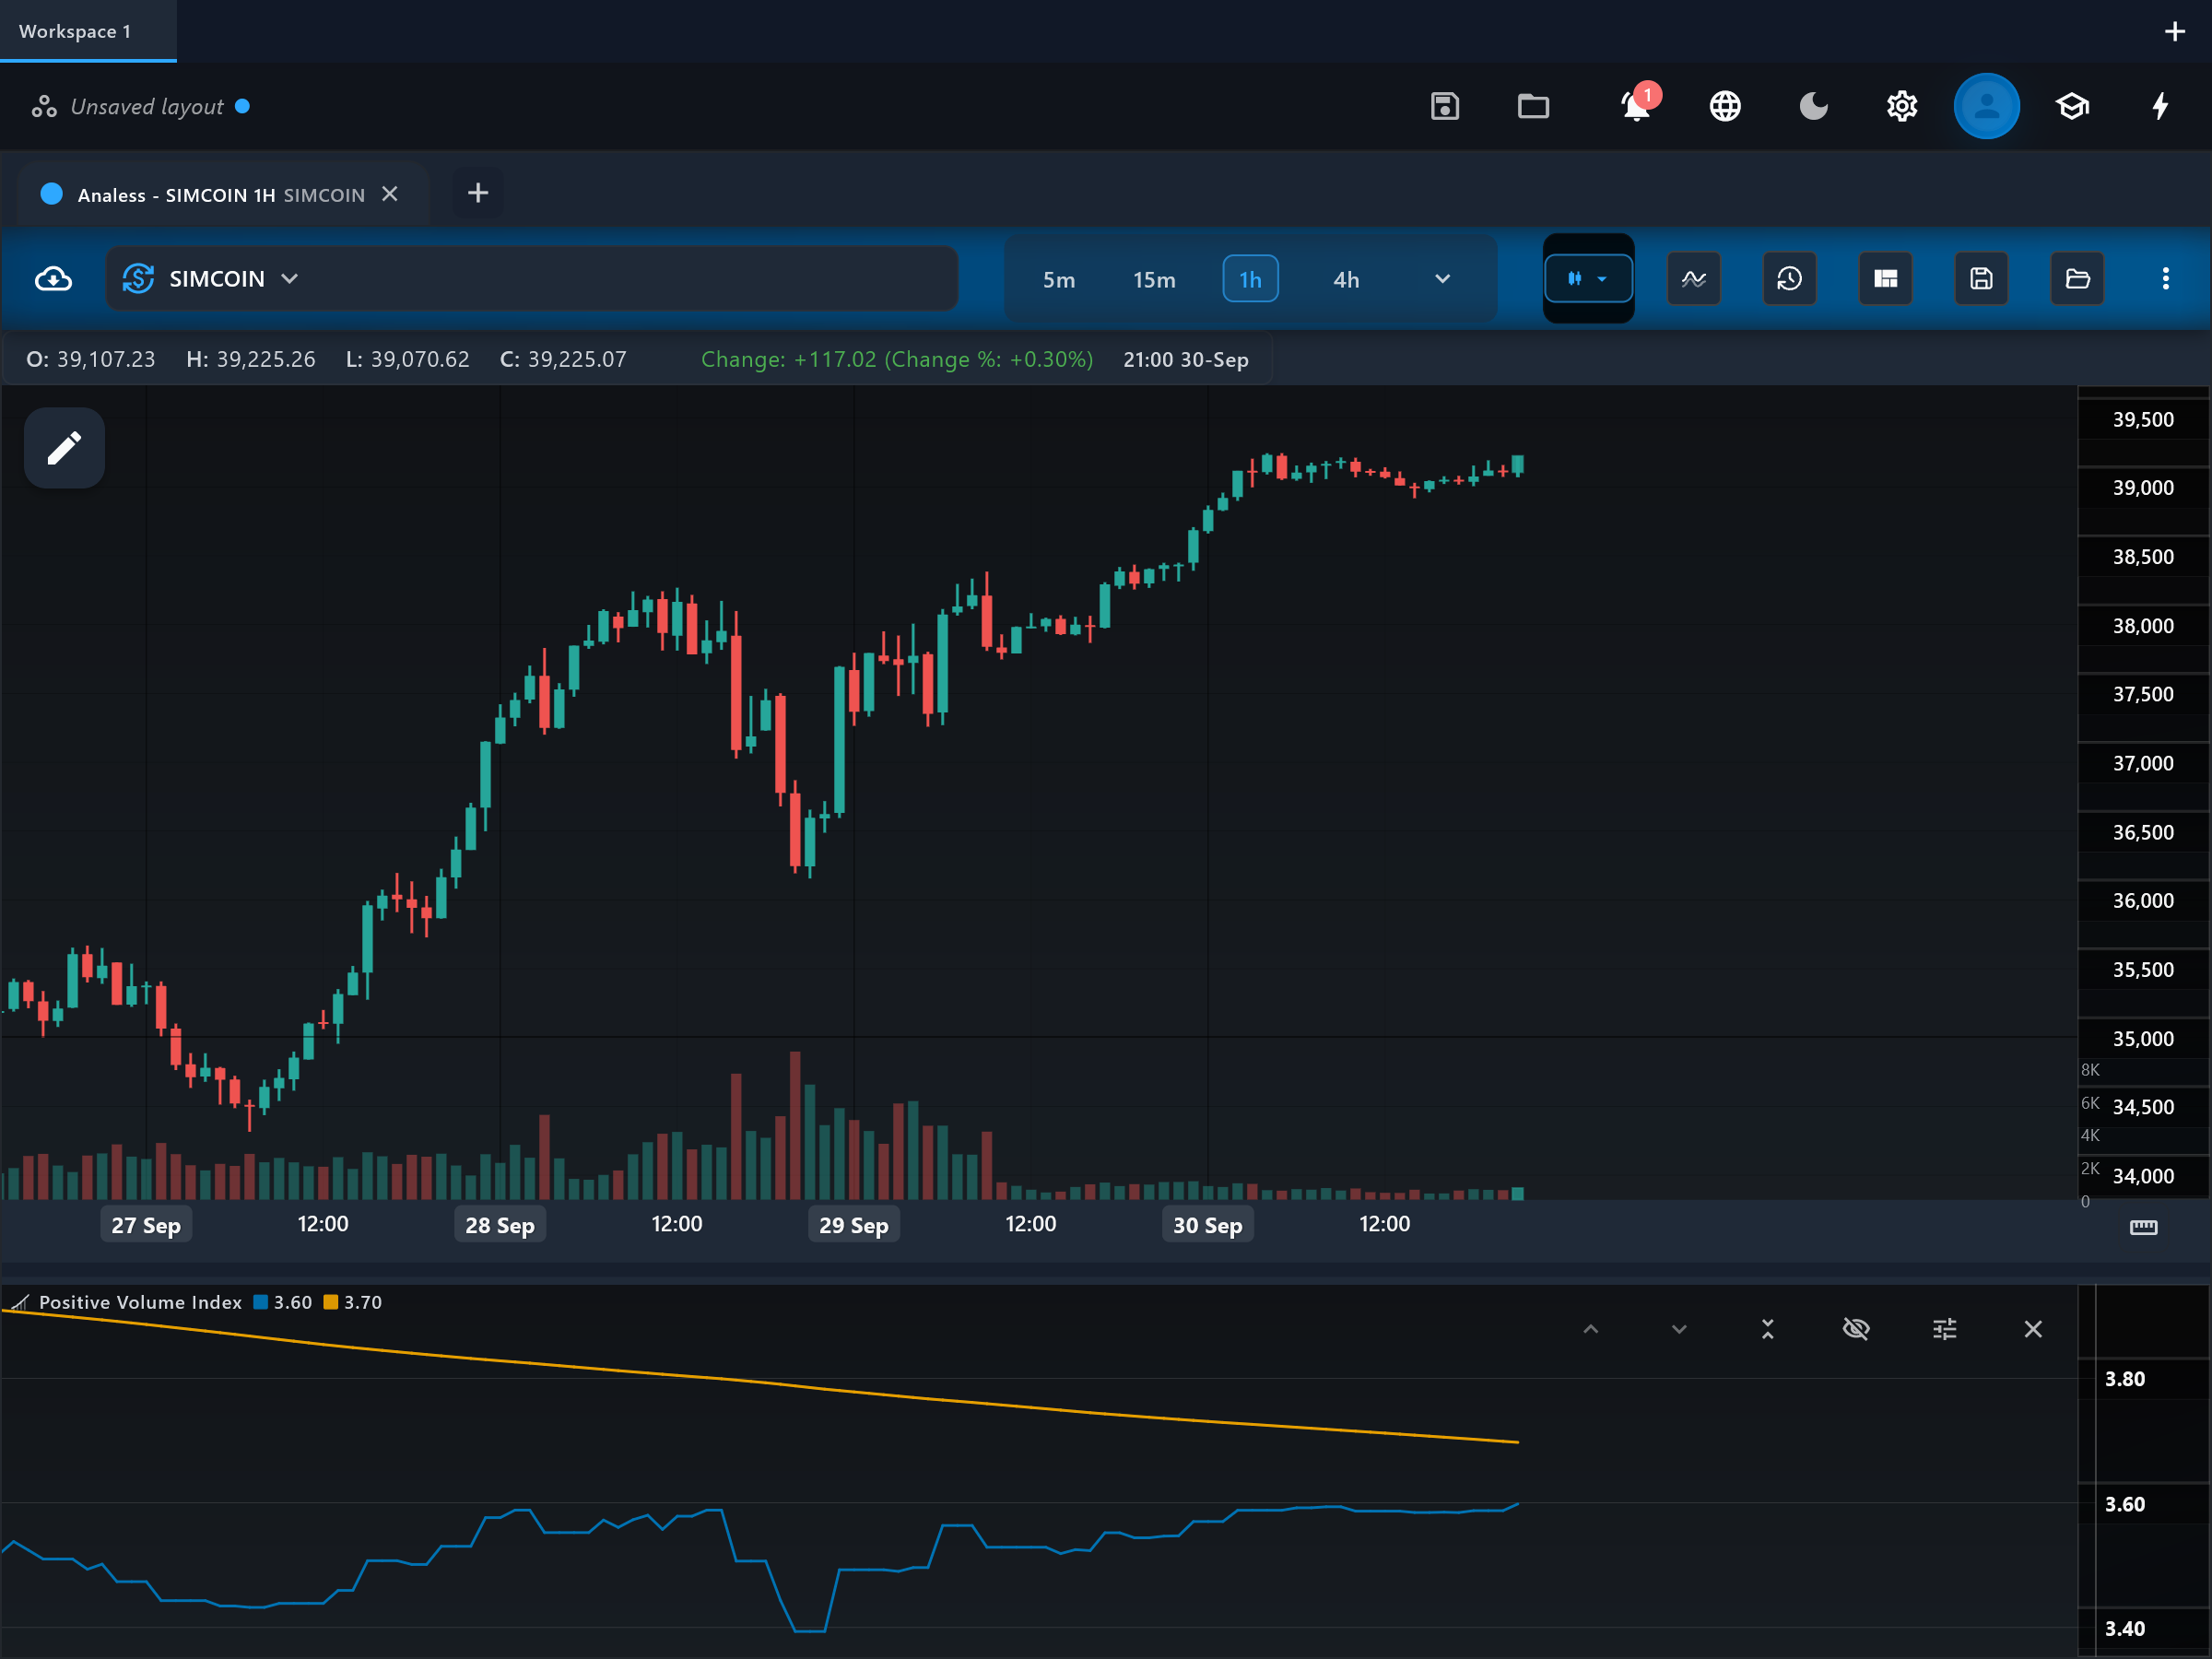
The Positive Volume Index (PVI) is the mirror of NVI: a cumulative line that updates only on bars where volume rose versus the previous bar. In the Fosback tradition, busy days reflect the crowd — enthusiastic, headline-driven participation — so PVI tracks what prices do when "everyone" is trading. That framing is tradition, not established fact.
How it is calculated
Starting from a base value, this app adds the bar's percentage price change to the running PVI only when the bar's volume is higher than the previous bar's; on lower-volume bars the line stays flat. A long simple moving average (default 255 bars) is drawn as the signal line.
How to read it
The "pvi" line moves only on rising-volume bars, so it captures how price behaves on active, crowded sessions. Its position versus the "signal" average is the conventional read: pvi above its long average means busy days have leaned positive over the past year, and below means crowded sessions have leaned negative. In Fosback's framework PVI was the weaker bull-market indicator and the more useful bear-market warning — historically, PVI dropping below its average preceded broad declines more reliably than NVI did. Read it alongside NVI for the quiet-day/busy-day contrast.
What to look for
- Trend filterUpside
PVI above its long signal average means high-volume sessions have been net positive — the crowd-participation regime is constructive.
- Trend filterDownside
PVI falling below its signal average is the traditional caution flag — busy, crowded sessions have started resolving lower.
- Signal-line crossContext
Crosses of pvi through its signal line are slow regime signals, best read together with NVI's position for the full Fosback picture.
When to use it
Like NVI, it was built for broad equity indices on daily charts and works as a slow regime filter, not a timing tool. Avoid thin symbols, where bar-to-bar volume comparisons are noise, and spot forex, where tick volume blurs the busy-day/quiet-day distinction the whole method rests on.
Works well with
Settings explained
signalPeriod- Length of the simple moving average over the PVI line (default 255 — about one year of daily bars). Shorter periods flip the regime read more often; the long default matches the indicator's original yearly-baseline design.
Limitations and common mistakes
- The "crowd trades on busy days" interpretation is Fosback-era tradition, not a verified mechanism.
- Signals are rare and slow by construction; it is unsuitable for short-term timing.
- Bar-to-bar volume comparisons are distorted by calendar effects, venue outages, and data quirks.
- Its statistical track record comes from decades-old daily US index data and may not transfer to other markets or timeframes.
References
- Origin: Paul Dysart, 1930s; popularized by Norman Fosback, 1976.
- Negative volume index — Wikipedia (opens in a new tab)
This page explains how an indicator is calculated and read. It describes past data, not what price will do next, and it is not a recommendation to trade. Read the disclaimers.
Try it in Analess
Add Positive Volume Index to any chart, adjust its settings, and open this explainer from the indicator itself.