















Indicators · Volume
Net Volume
Up-volume minus down-volume over a period.
Origin: Raw market data signed by bar direction—no single originator
- Best suited to
- Any market condition
- Responsiveness
- Coincident
- Family
- Volume
What it is
Net Volume assigns each bar's volume a sign — positive on an up close, negative on a down close — and tracks the running balance. It is a simple way to see whether up-bars or down-bars are carrying the volume over time.
How it is calculated
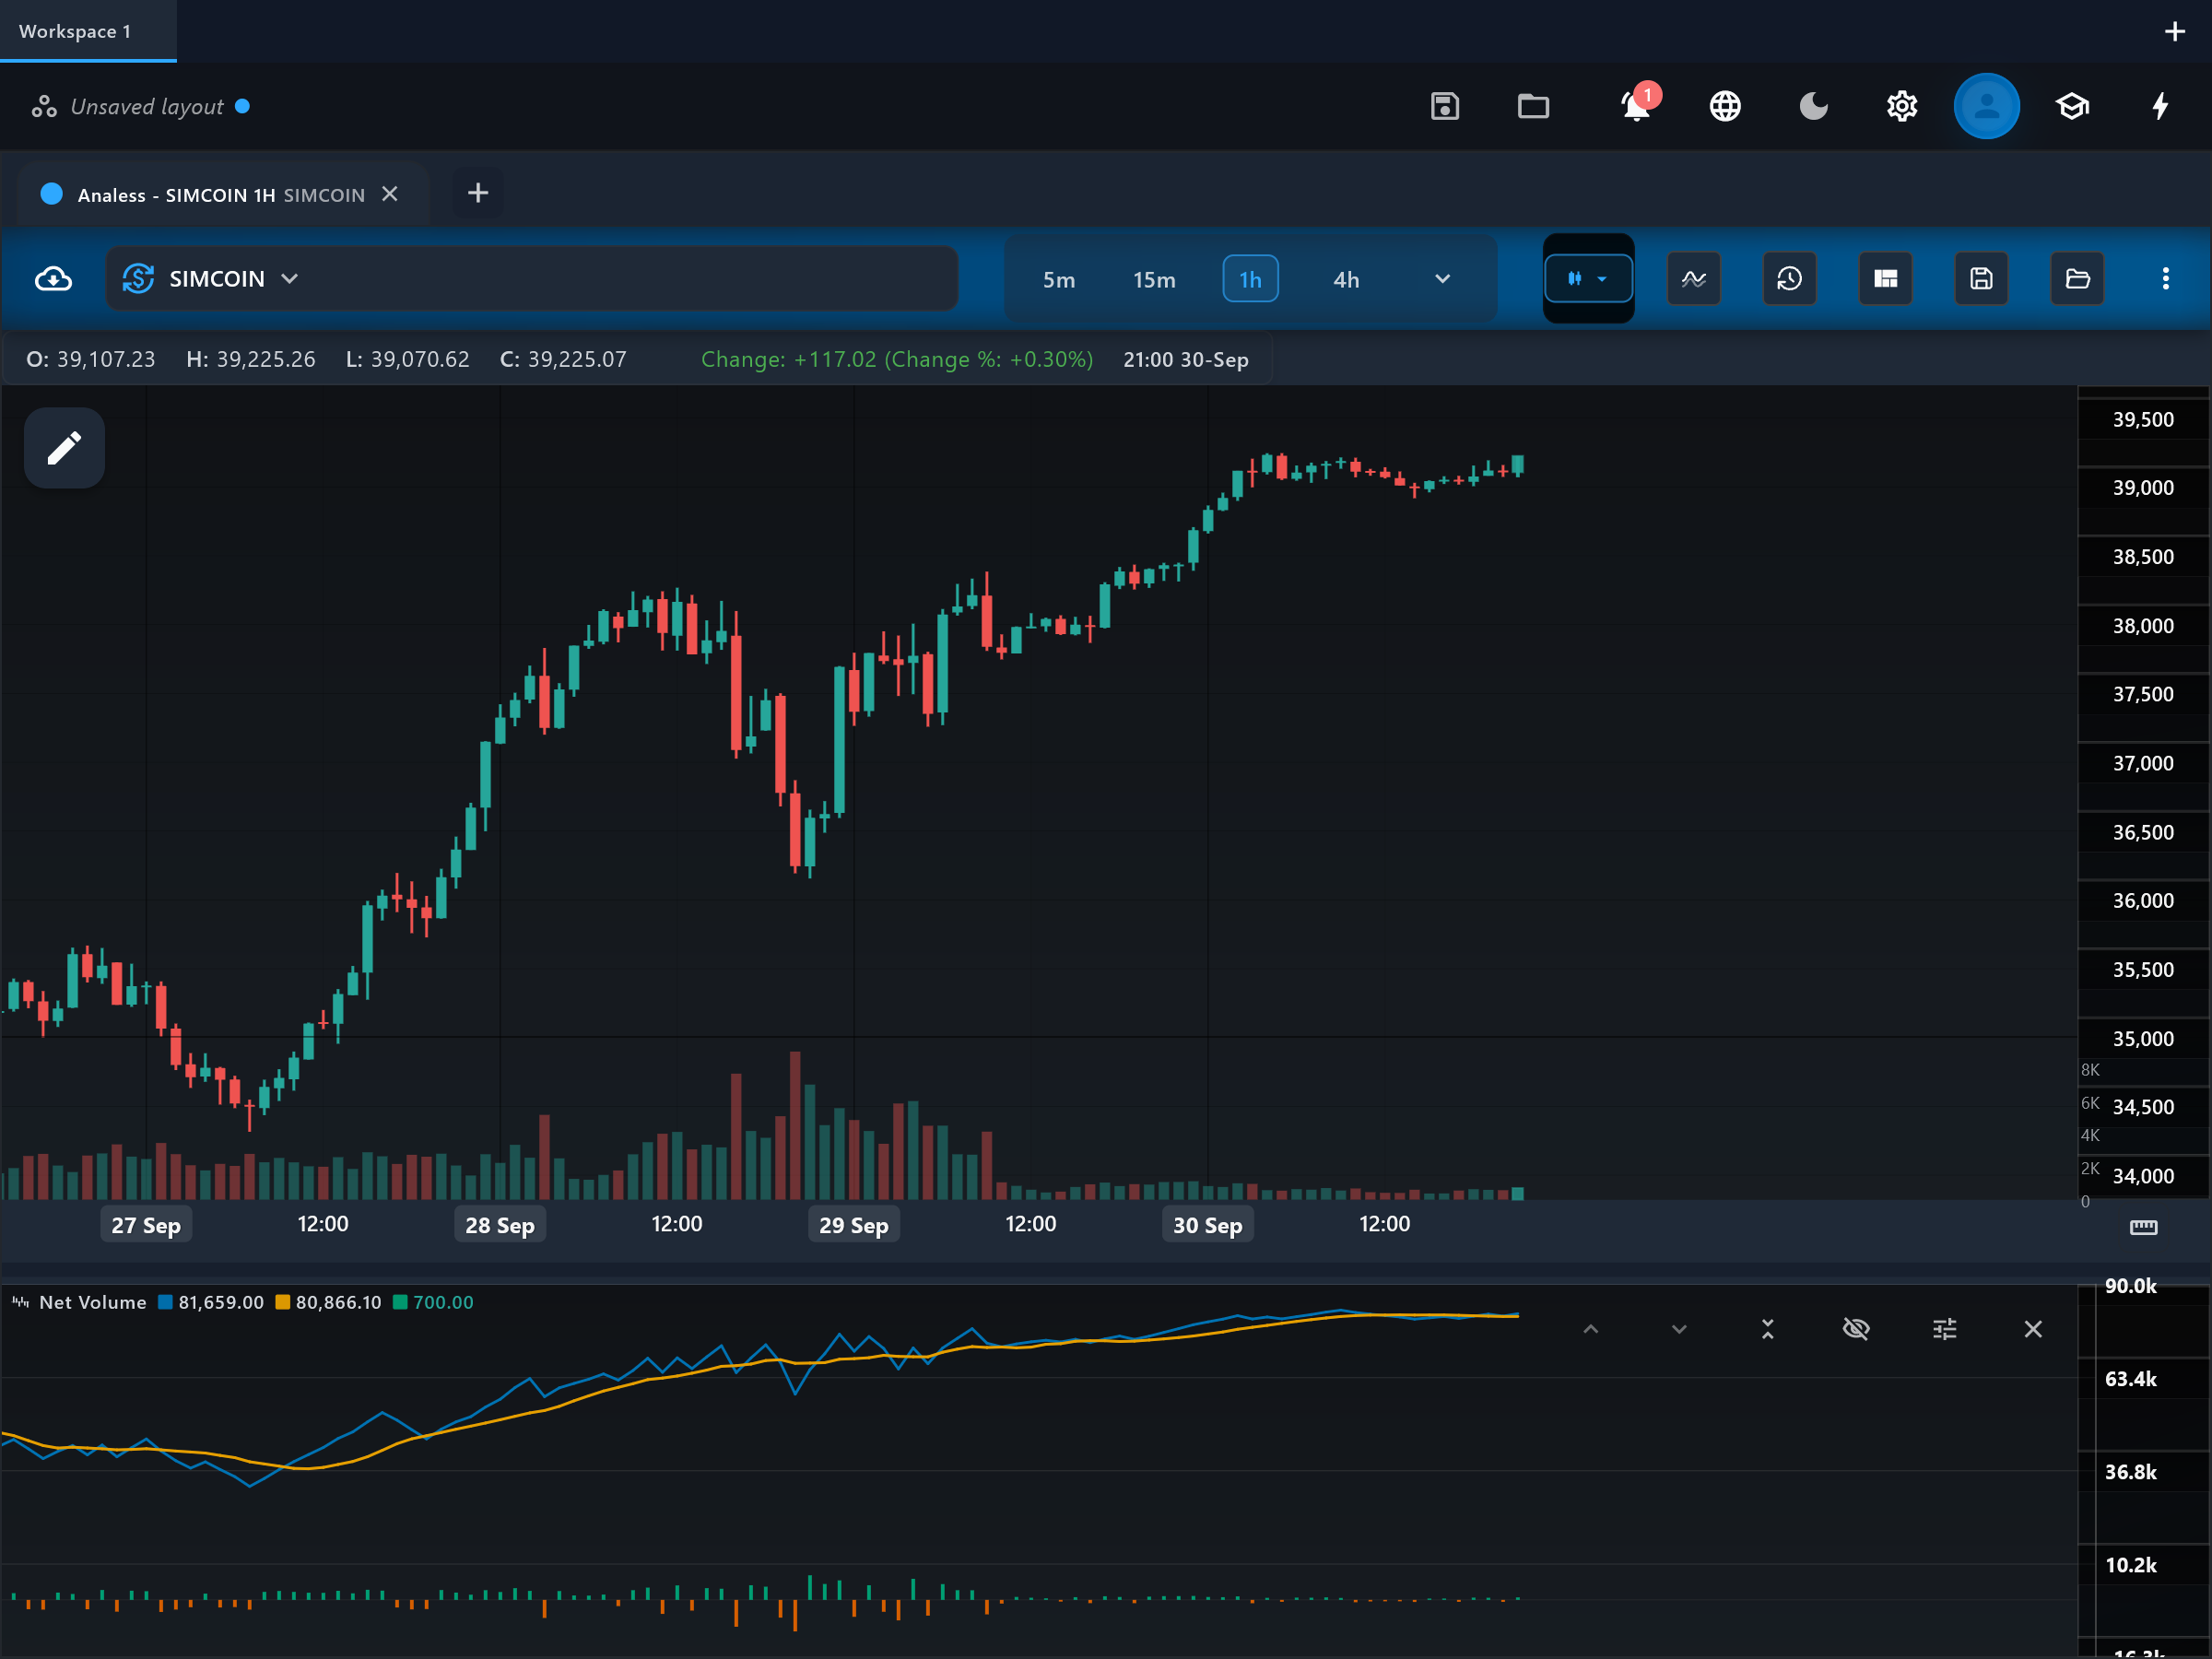
This app plots three things: a per-bar histogram of signed volume (the bar's full volume, positive or negative by close direction), a cumulative line summing that signed volume (equivalent to OBV), and a simple moving average of the cumulative line as a signal.
How to read it
The "volume_direction_histogram" shows each bar's volume above or below zero by close direction — clusters of tall positive bars mean the volume is arriving on up closes. The "net_volume_line" accumulates those bars, so its slope summarizes which side has been winning the volume battle; read its direction and its highs/lows against price, not its absolute value. The "signal_line" smooths the cumulative line, and the line holding above its signal keeps the net-flow picture positive.
What to look for
- ConfirmationUpside
The net_volume_line pushing to new highs alongside a price breakout confirms that up-close bars are carrying the volume.
- DivergenceContext
Price trending while the net_volume_line flattens or moves the other way is a divergence — the trend's volume support is weakening.
- Signal-line crossContext
The net_volume_line crossing its signal_line marks a change in the short-term balance of signed volume flow.
When to use it
Useful on any liquid market with real reported volume — stocks, futures, centralized crypto — on any timeframe. Thin or illiquid symbols make the histogram spiky and the cumulative line unrepresentative, and spot-forex tick volume only approximates true participation.
Works well with
Settings explained
signalPeriod- Length of the simple moving average drawn over the cumulative net-volume line (default 10). Shorter values produce more frequent signal crosses; longer values track only the larger shifts in net flow.
Limitations and common mistakes
- Like OBV, it is all-or-nothing per bar: a one-tick up close counts its entire volume as positive.
- The cumulative line's absolute value depends on where the data starts; only slope and relative levels matter.
- One extreme-volume bar permanently offsets the cumulative line.
- It carries no information about intrabar structure — a bar that reversed hard but closed up a tick still counts fully positive.
References
- Origin: Raw market data signed by bar direction—no single originator.
- Volume (finance) — Wikipedia (opens in a new tab)
This page explains how an indicator is calculated and read. It describes past data, not what price will do next, and it is not a recommendation to trade. Read the disclaimers.
Try it in Analess
Add Net Volume to any chart, adjust its settings, and open this explainer from the indicator itself.