















Indicators · Momentum & oscillators
PPO
Percentage Price Oscillator — MACD expressed in percent, so it compares across instruments.
Origin: Gerald Appel, 1970s—the MACD expressed as a percentage
- Best suited to
- Trending markets
- Responsiveness
- Lagging
- Family
- Momentum & oscillators
What it is
The Percentage Price Oscillator (PPO) is MACD expressed in percent: the gap between the fast and slow EMA divided by the slow EMA. Because it is a percentage, its readings are comparable across symbols and price levels, unlike MACD's absolute values.
How it is calculated
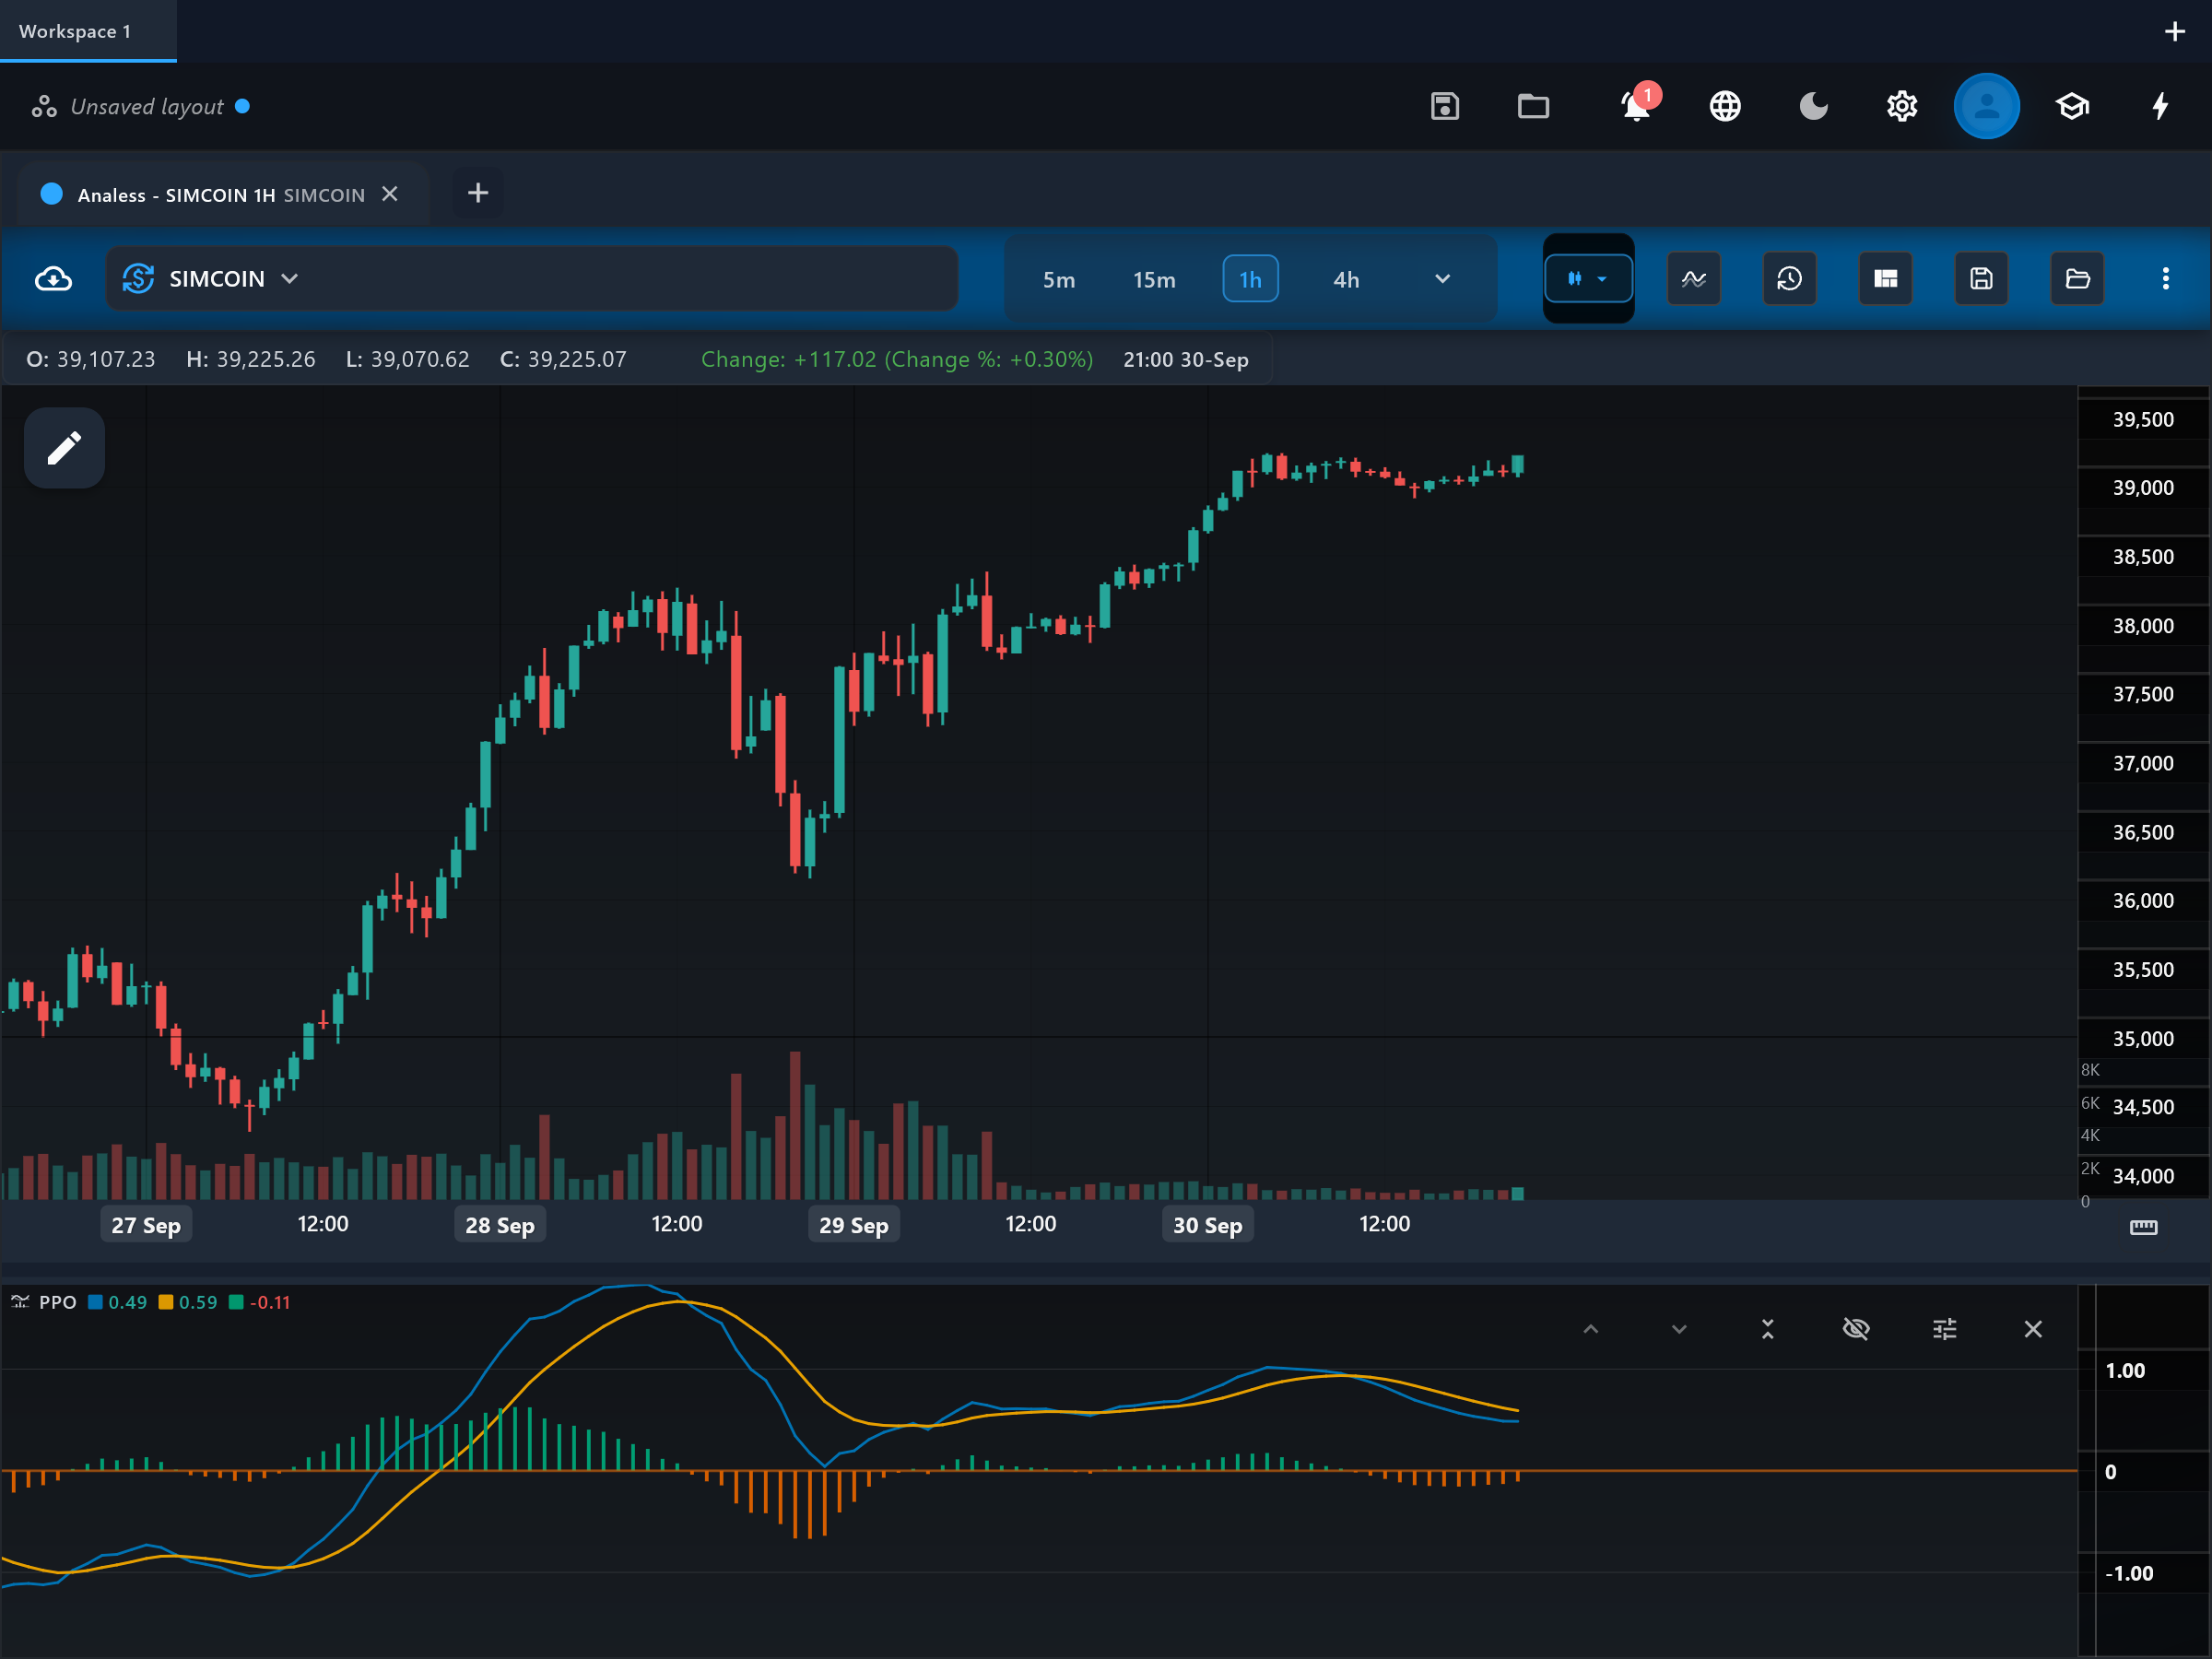
PPO = 100 x (EMA(fast) - EMA(slow)) / EMA(slow), with defaults 12 and 26 on the chosen source. A signal line (EMA of PPO, default 9) and a histogram (PPO minus signal) complete the pane — exactly the MACD construction, normalized by the slow EMA.
How to read it
The pane shows the "ppo" line, its "signal" line, the "histogram" bars, and a "zero" reference line. A ppo value of 2 means the fast EMA is 2 percent above the slow EMA, whatever the symbol's price. Above zero the EMA alignment is bullish, below zero bearish; the histogram shows the ppo-signal gap, shrinking ahead of each cross. Read it exactly like MACD, but with values you can compare across charts.
What to look for
- Signal-line crossUpside
ppo crossing above its signal line indicates momentum turning up, same as a MACD bullish cross.
- Signal-line crossDownside
ppo crossing below its signal line indicates momentum turning down.
- Centre-line crossContext
A zero-line cross marks the fast EMA crossing the slow EMA — a trend-level direction change.
- DivergenceContext
Price/PPO divergence at new highs or lows warns that the percentage momentum behind the move is fading.
When to use it
PPO shines when you compare momentum across instruments with very different prices — a portfolio of stocks, or crypto pairs quoted at wildly different levels — and in trending conditions generally. Like MACD it whipsaws in flat, rangebound markets, so avoid relying on crosses when the ppo line is flatlining near zero. It is unbounded, so there are no fixed overbought/oversold levels.
Works well with
Settings explained
fastPeriod- Default 12 — the fast EMA. Lower for earlier, noisier readings; higher for smoother, later ones.
slowPeriod- Default 26 — the slow EMA that also serves as the percentage denominator. Widening the fast/slow gap emphasizes larger trends.
signalPeriod- Default 9 — the EMA of the ppo line. Lower values produce earlier but more frequent crosses; higher values filter them.
source- Default close — the price series the EMAs are computed from.
Limitations and common mistakes
- Same lag as MACD: it is built from moving averages and signals after the turn.
- Whipsaws in ranging markets when the EMAs are intertwined.
- Percent normalization aids comparison but does not make it bounded — extreme values still have no fixed ceiling.
References
- Origin: Gerald Appel, 1970s—the MACD expressed as a percentage.
This page explains how an indicator is calculated and read. It describes past data, not what price will do next, and it is not a recommendation to trade. Read the disclaimers.
Try it in Analess
Add PPO to any chart, adjust its settings, and open this explainer from the indicator itself.