















Indicators · Volume
Price Volume Trend
A cumulative line that weights volume by the percent change in price.
Origin: Classical volume construct—no single originator
- Best suited to
- Trending markets
- Responsiveness
- Leading
- Family
- Volume
What it is
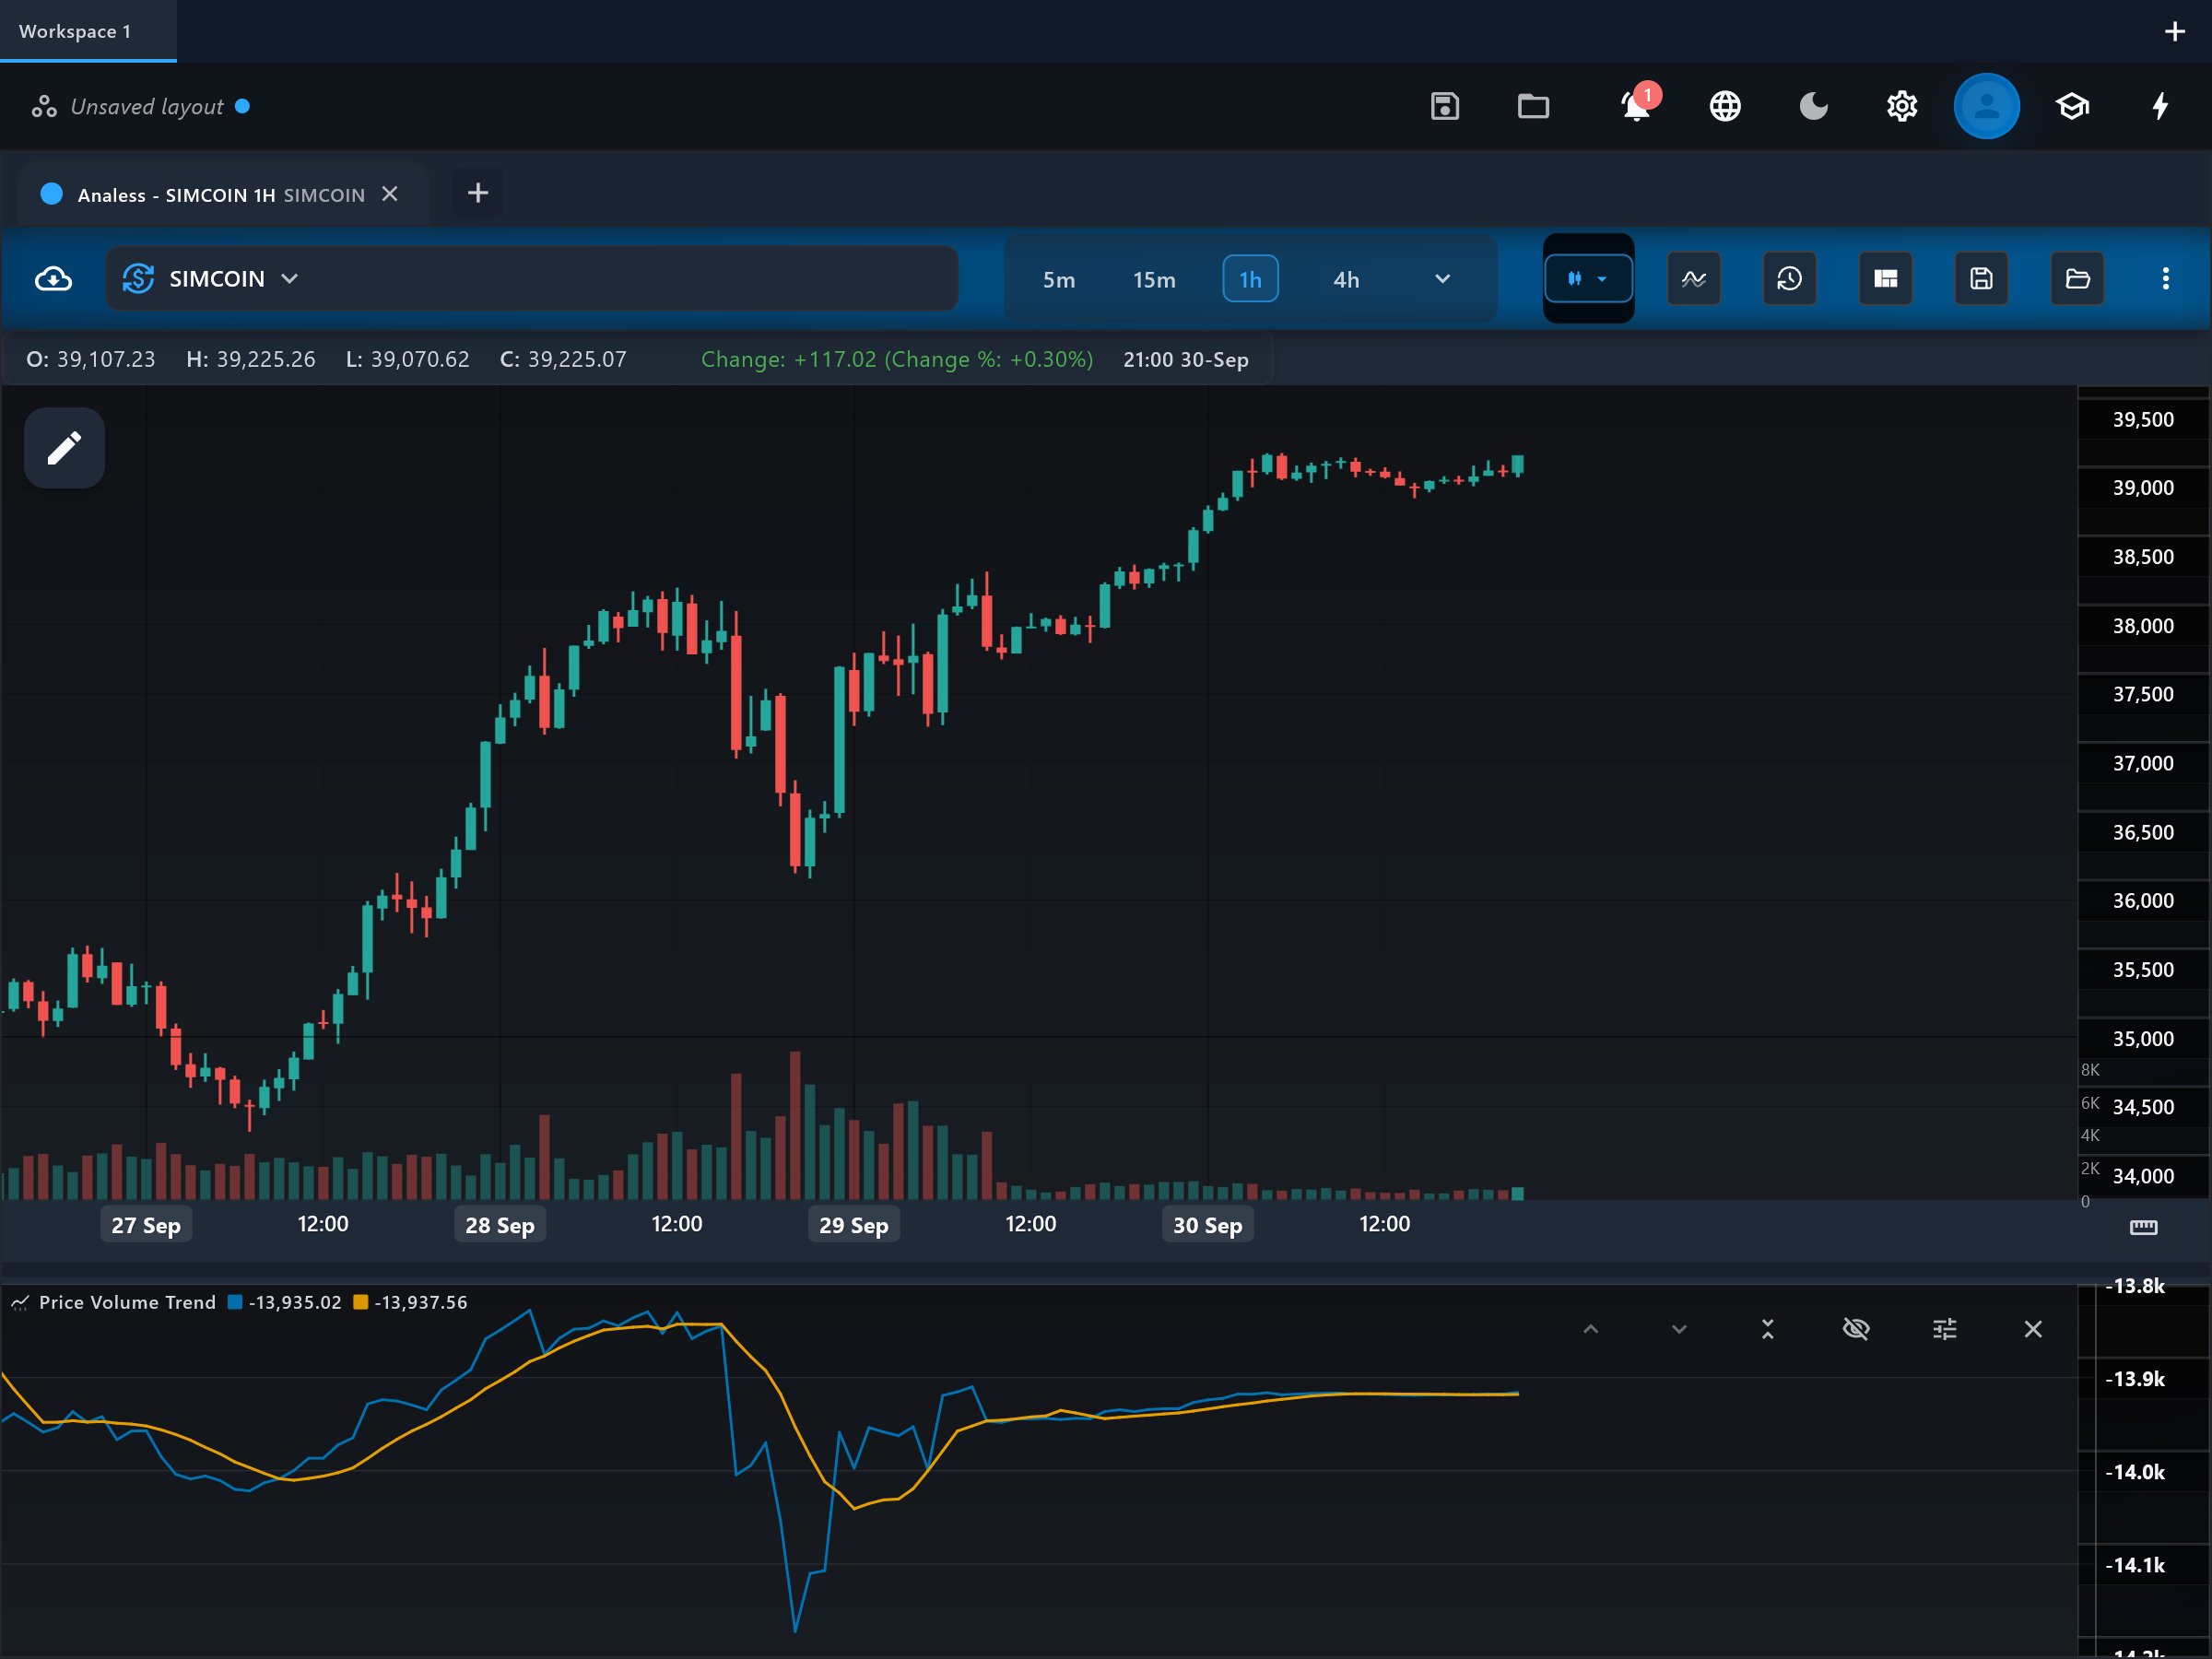
Price Volume Trend (PVT) is a cumulative volume line, like OBV, but proportional: instead of adding or subtracting the whole bar's volume, it adds volume scaled by the bar's percentage price change. A big up day contributes much more than a marginal one, so the line reflects both conviction and magnitude.
How it is calculated
For each bar this app computes (close change / previous close) x volume and adds it to a running total. A simple moving average of the PVT line (default 9) is drawn as a signal line.
How to read it
The "pvt" line is read like OBV — direction, slope, and divergences against price, never the absolute value, which depends on where the loaded history begins. Because contributions are proportional to the percentage move, pvt rises fastest when large up-moves occur on heavy volume, and a shallow slope during a rally reveals that the up-bars are small, reluctant, or thinly traded. The "signal_line" smooths pvt, and crosses between the two mark shifts in the recent flow.
What to look for
- ConfirmationUpside
PVT accelerating to new highs with price confirms that the advance is built from meaningful percentage gains on real volume.
- DivergenceDownside
Price making a higher high while pvt makes a lower high suggests the new high came on smaller moves or lighter volume.
- DivergenceUpside
Price making a lower low while pvt holds higher suggests down-bars are shrinking in percentage terms or drying up in volume.
- Signal-line crossContext
The pvt line crossing its signal_line marks a short-term change in cumulative flow, similar to OBV signal crosses but weighted by move size.
When to use it
Suits liquid stocks and major crypto pairs on daily and intraday timeframes, especially when you want OBV's story with magnitude sensitivity. Thin or illiquid symbols distort it doubly (erratic volume times erratic percentage moves), and spot-forex tick volume weakens the volume half of the product.
Works well with
Settings explained
signalPeriod- Length of the simple moving average drawn over the PVT line (default 9). Shorter values give earlier but noisier signal-line crosses; longer values track only the larger swings in cumulative flow.
Limitations and common mistakes
- Absolute values are meaningless — the line's level depends entirely on where the data series begins.
- A single bar combining a huge percentage move with huge volume permanently offsets the line.
- Percentage weighting makes it jumpier than OBV around gaps and news bars.
- Divergences can lead price by a long, unhelpful margin.
References
- Origin: Classical volume construct—no single originator.
- Volume–price trend — Wikipedia (opens in a new tab)
This page explains how an indicator is calculated and read. It describes past data, not what price will do next, and it is not a recommendation to trade. Read the disclaimers.
Try it in Analess
Add Price Volume Trend to any chart, adjust its settings, and open this explainer from the indicator itself.