















Indicators · Volatility
Relative Volatility Index
Applies an RSI-style calculation to standard deviation to measure the direction of volatility.
Origin: Donald Dorsey, 1993
- Best suited to
- Trending markets
- Responsiveness
- Lagging
- Family
- Volatility
What it is
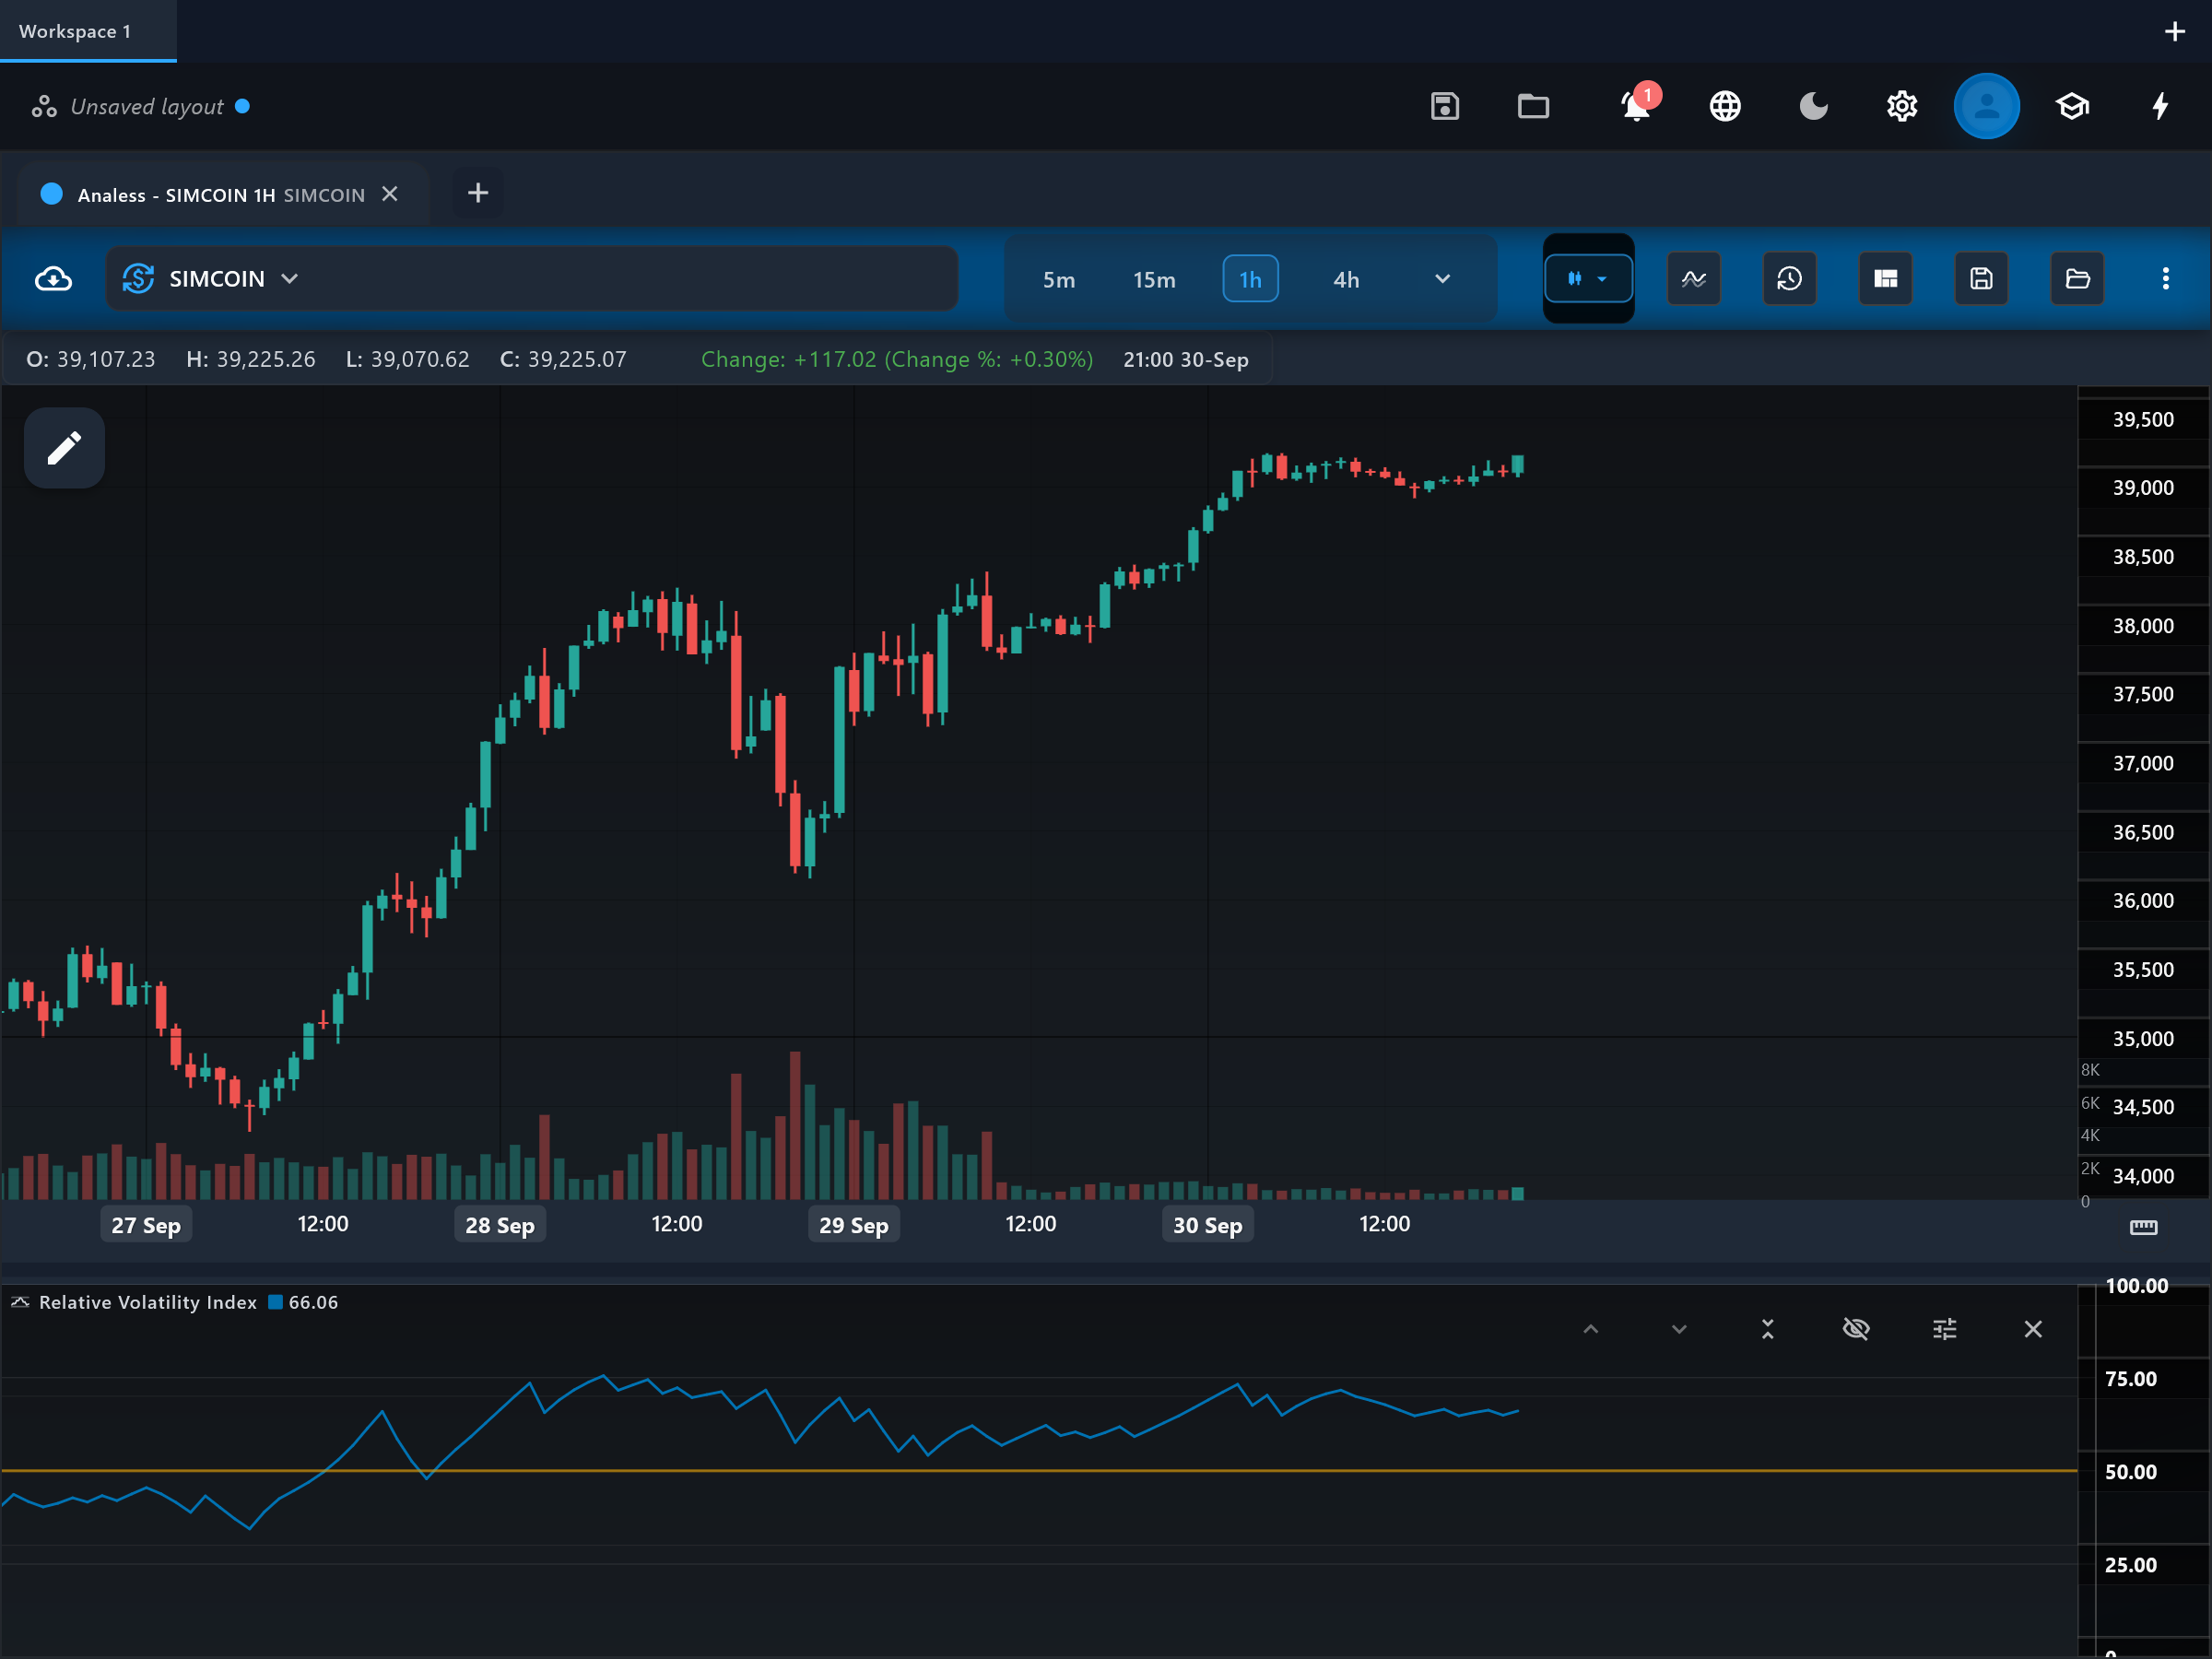
The Relative Volatility Index (RVI) applies the RSI formula to volatility instead of price change: it measures whether volatility is being spent on up-moves or down-moves. Dorsey designed it as a confirmation filter for other signals, not as a standalone system. It should not be confused with the Relative Vigor Index, a different indicator that shares the RVI acronym.
How it is calculated
A rolling standard deviation of the selected price source is computed over volatilityPeriod (default 10). Each bar's standard deviation is then assigned to the "up" bucket if price rose that bar, or the "down" bucket if it fell, and the two buckets are smoothed and combined with the RSI formula over period (default 14). The result is a 0-100 oscillator: above 50 means volatility is concentrated on up bars, below 50 on down bars.
How to read it
The pane shows the rvi line with a midline guide at 50. Sustained readings above 50 mean the market's energy is flowing upward — a bullish backdrop — while readings below 50 mean volatility is being spent on declines. Dorsey's original rules used 60 and 40 as confirmation thresholds: upside readings from other tools counted only with rvi above 60, and downside readings only with rvi below 40. Unlike most indicators in this group, RVI IS directional, because it separates up-bar from down-bar volatility.
What to look for
- ConfirmationUpside
rvi above 60 confirms upside readings from other indicators — volatility is concentrated on the upside (Dorsey's original usage).
- ConfirmationDownside
rvi below 40 confirms downside readings — the market's energy is on the downside.
- Centre-line crossContext
Crosses of the 50 midline mark the balance of volatility shifting between buyers and sellers.
- DivergenceContext
Price making a new extreme while rvi fails to follow suggests the move is happening on fading energy.
When to use it
Best used exactly as designed: a confirmation overlay on top of trend or momentum signals, on daily or intraday charts of liquid symbols. It is weakest as a standalone trigger — its crossings lag price turns because of the double smoothing. In dead-quiet markets the standard deviation input is tiny and the reading becomes noisy.
Works well with
Settings explained
volatilityPeriod- The window of the standard-deviation input (default 10). Shorter values make the volatility estimate — and thus the oscillator — more reactive.
period- The RSI-style smoothing length (default 14). Longer values produce a steadier line with fewer midline whipsaws.
source- The price whose standard deviation and direction are measured (default close).
Limitations and common mistakes
- Easily confused with the Relative Vigor Index — they share an acronym but measure different things.
- Double smoothing (standard deviation, then RSI averaging) makes it slow at turning points.
- Designed as a confirmation filter; using it on its own was explicitly not Dorsey's intent.
References
- Origin: Donald Dorsey, 1993.
This page explains how an indicator is calculated and read. It describes past data, not what price will do next, and it is not a recommendation to trade. Read the disclaimers.
Try it in Analess
Add Relative Volatility Index to any chart, adjust its settings, and open this explainer from the indicator itself.