















Indicators · Momentum & oscillators
Relative Vigor Index (RVI)
Compares closing strength to the bar’s range to gauge conviction behind a move.
Origin: John F. Ehlers, 2002
- Best suited to
- Trending markets
- Responsiveness
- Coincident
- Family
- Momentum & oscillators
What it is
The Relative Vigor Index (RVI) measures the "vigor" of a move: the tendency of price to close higher than it opens in uptrends and lower than it opens in downtrends. It compares where price closes within each bar's range, smoothed over a window, producing an oscillator that tracks the conviction behind the trend. Note the name: this is the Relative Vigor Index — a different indicator from Donald Dorsey's Relative Volatility Index, which shares the RVI abbreviation but measures volatility direction instead.
How it is calculated
The close-minus-open and high-minus-low differences are each run through Ehlers' symmetric 4-bar weighted smoother ((a + 2b + 2c + d) / 6), then each is averaged with a simple moving average over the lookback (default 10). RVI is the ratio of the smoothed close-open average to the smoothed high-low average — roughly, "how much of the bar's range did the bulls or bears actually keep?". A signal line is formed by applying the same symmetric 4-bar smoother to the RVI itself.
How to read it
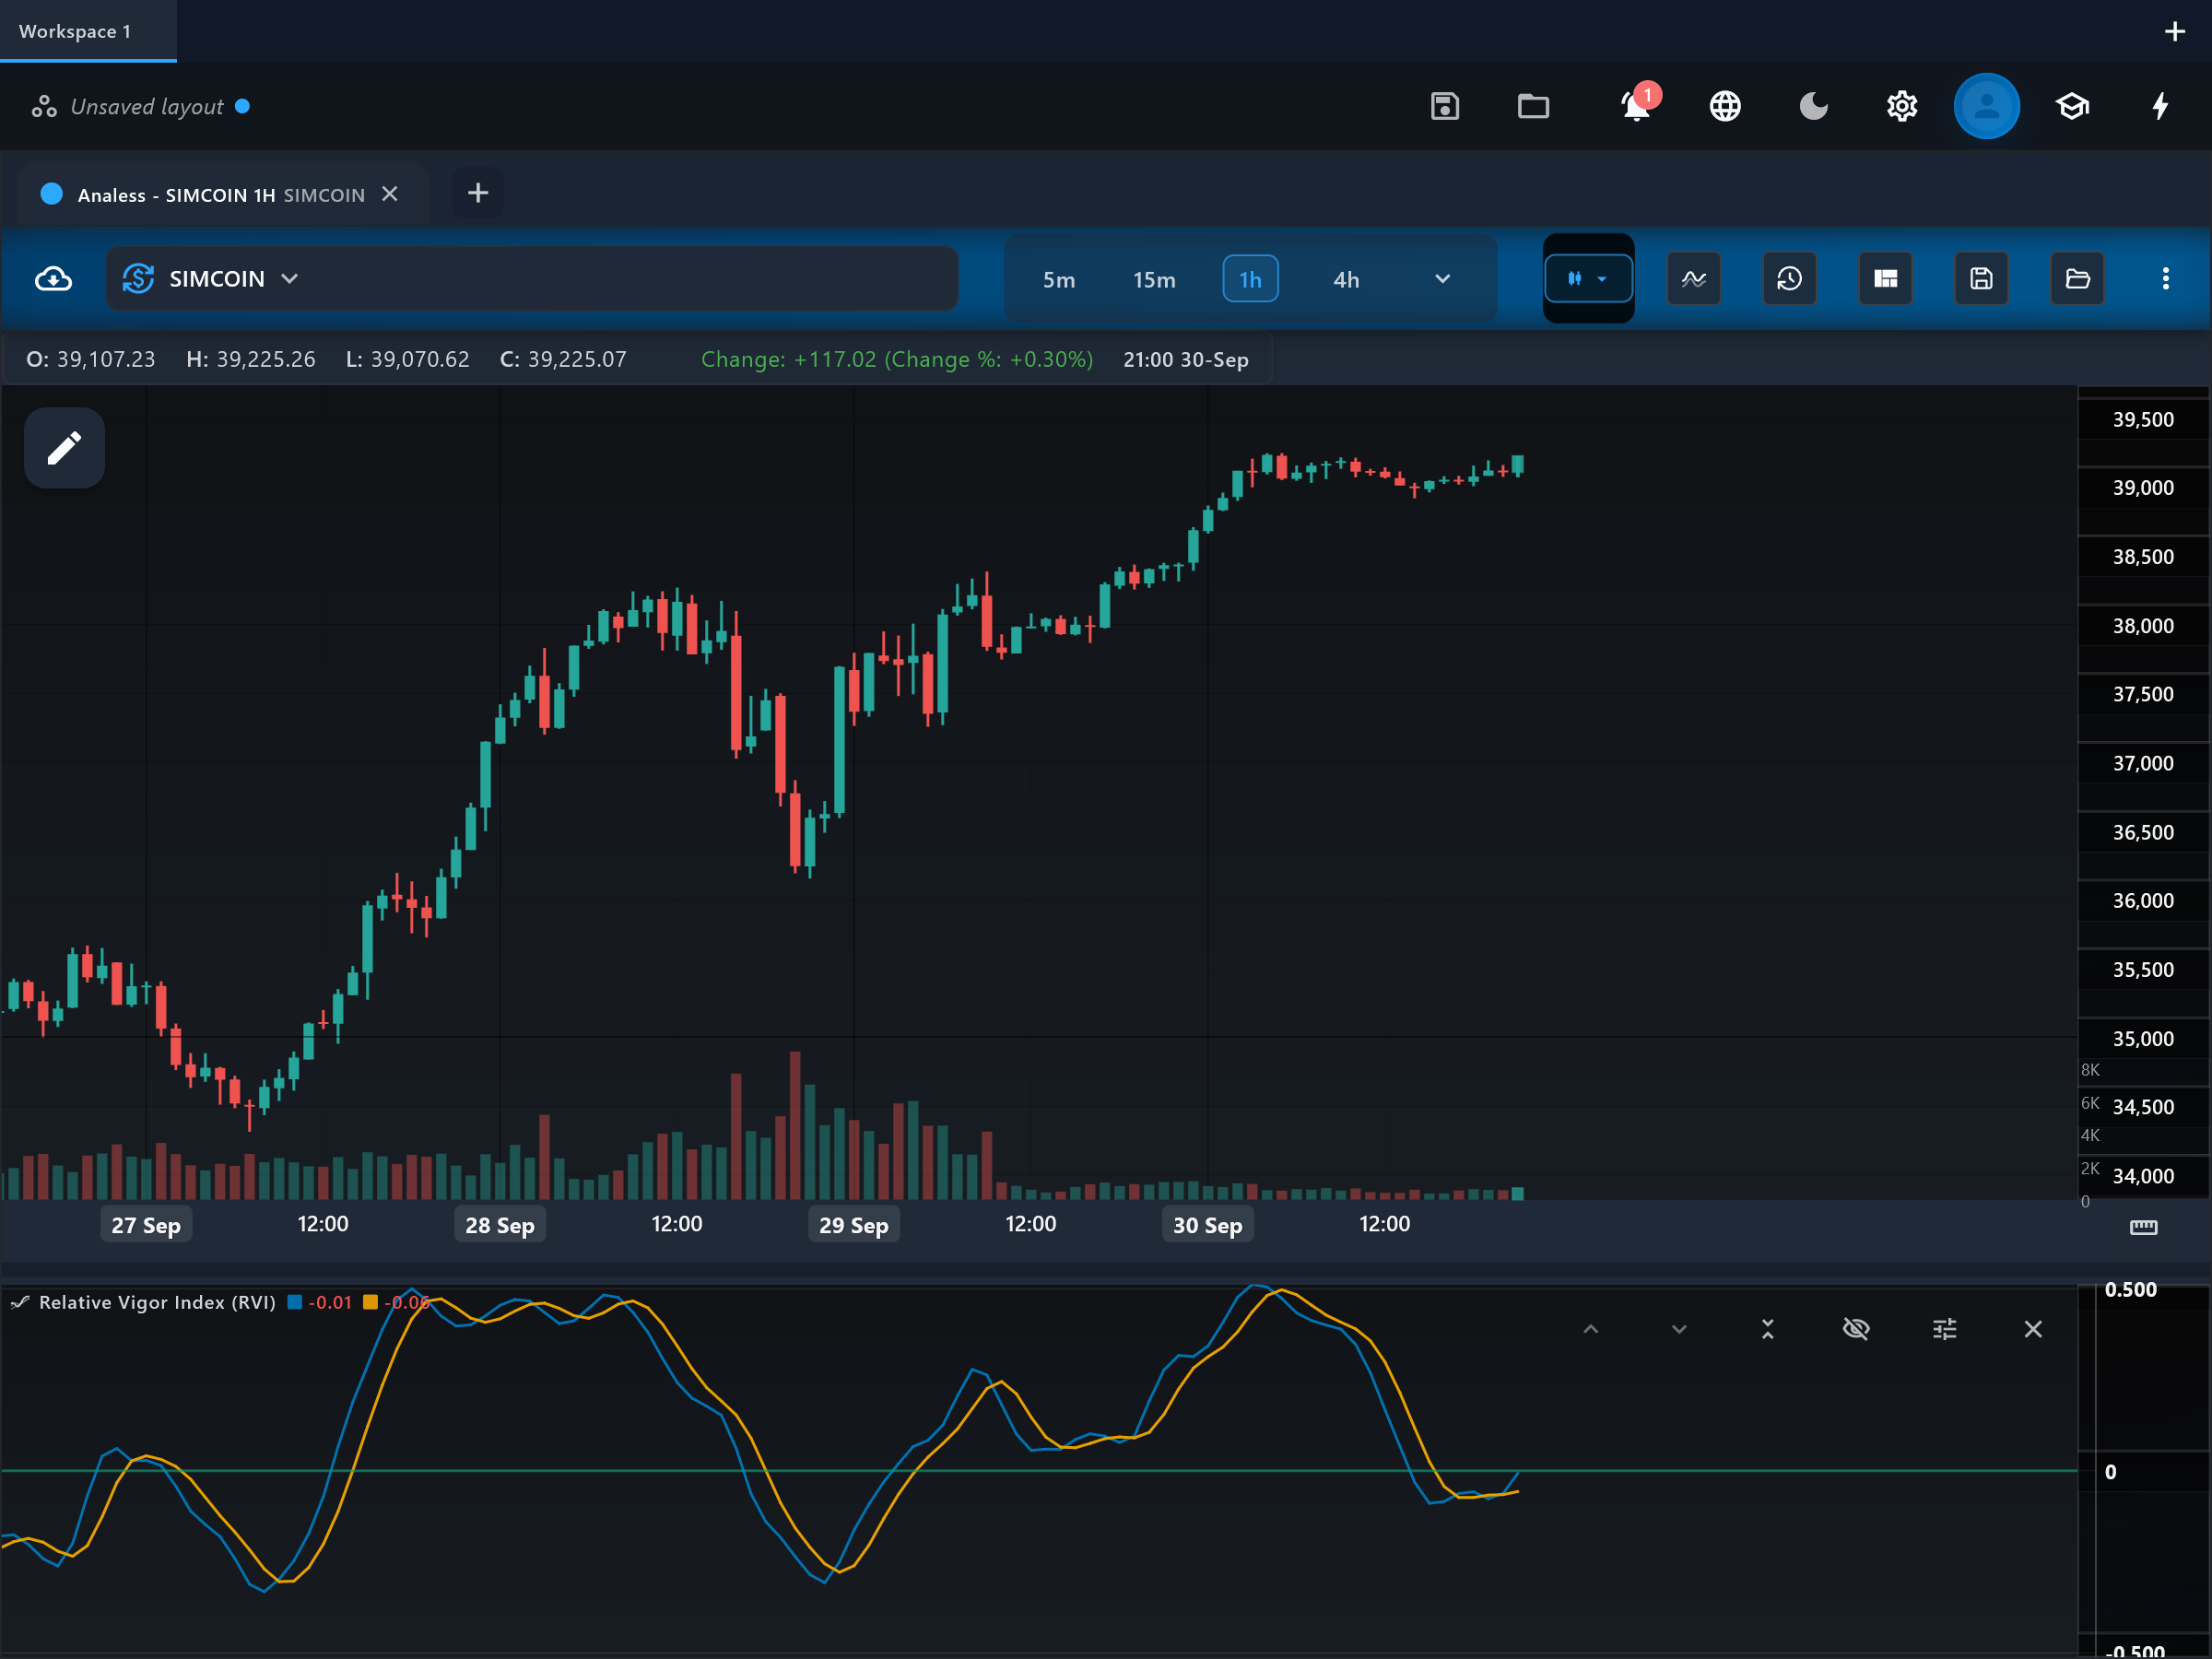
Two lines oscillate around the "zero" level: "rvi" and its smoothed "signal". RVI above zero means closes have persistently beaten opens — buying vigor; below zero, selling vigor. The primary timing tool is the crossover between "rvi" and "signal", read with the trend: crosses in the direction of the prevailing trend are the higher-quality ones. Divergences between RVI swings and price swings warn that the conviction behind a trend is fading.
What to look for
- Signal-line crossUpside
The "rvi" line crosses above its "signal" line, showing closing vigor turning up — strongest when aligned with an existing uptrend.
- Signal-line crossDownside
The "rvi" line crosses below its "signal" line, showing closing vigor rolling over.
- Centre-line crossContext
A zero cross marks the balance of closes shifting from one side of the opens to the other — a slower confirmation of the vigor regime.
- DivergenceContext
Price sets a new high or low that RVI does not, suggesting the bars are closing with less conviction than before.
When to use it
RVI behaves best in markets with a discernible trend or steady swing rhythm — liquid FX, indexes, and large-cap stocks on intraday to daily bars — where close-versus-open conviction is informative. It is usually used as a confirmation tool next to a trend indicator rather than as a stand-alone trigger. Avoid it on instruments with frequent opening gaps or in dead, narrow ranges, where close-minus-open carries little signal.
Works well with
Settings explained
period- The SMA window applied to the smoothed close-open and high-low series. The default 10 is Ehlers' published value. Longer periods give a smoother, slower vigor reading; shorter ones track individual swings more tightly but cross the signal line more often.
Limitations and common mistakes
- The abbreviation clash is real — screeners and articles labelled "RVI" sometimes mean the Relative Volatility Index, a different formula entirely.
- The multiple smoothing stages introduce lag, so crosses trail the actual turn in vigor.
- On instruments that gap at the open, close-minus-open no longer reflects intrabar conviction and readings degrade.
References
- Origin: John F. Ehlers, 2002.
This page explains how an indicator is calculated and read. It describes past data, not what price will do next, and it is not a recommendation to trade. Read the disclaimers.
Try it in Analess
Add Relative Vigor Index (RVI) to any chart, adjust its settings, and open this explainer from the indicator itself.