















Indicators · Momentum & oscillators
SMI Ergodic Oscillator
A double-smoothed momentum oscillator with a signal line — a smoother take on the True Strength Index.
Origin: William Blau, 1990s
- Best suited to
- Trending markets
- Responsiveness
- Lagging
- Family
- Momentum & oscillators
What it is
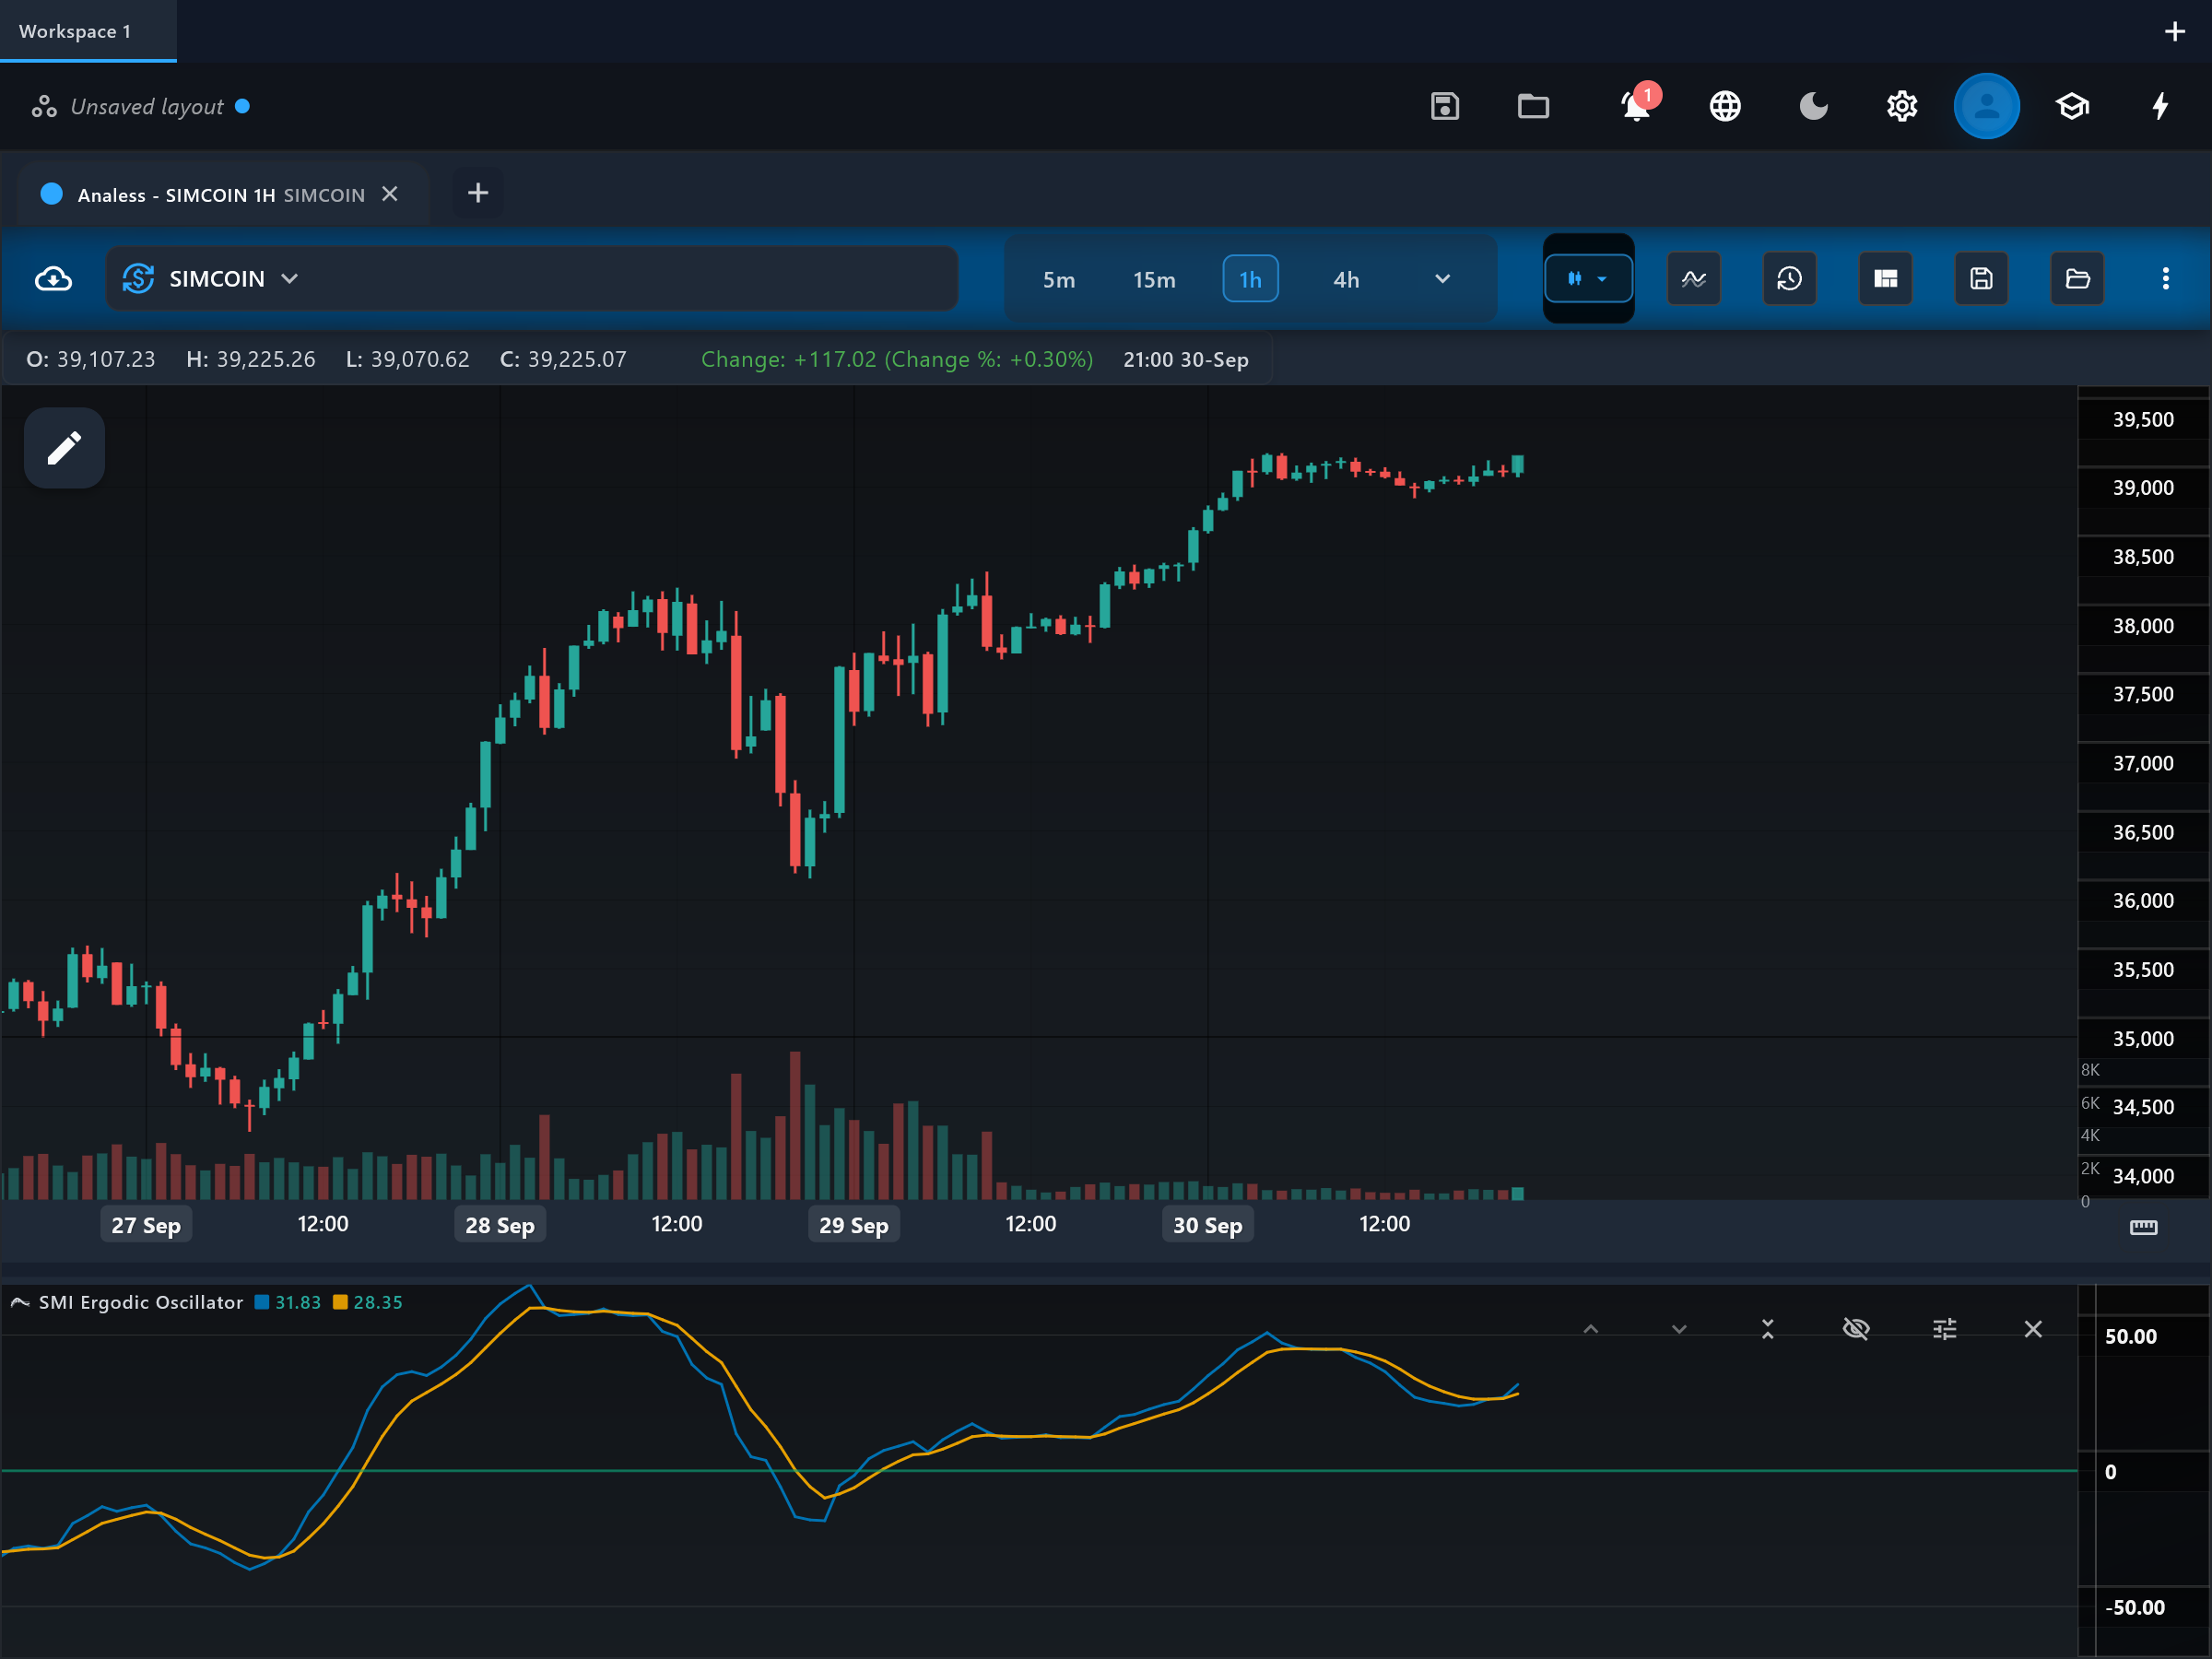
The SMI Ergodic Oscillator is William Blau's double-smoothed momentum indicator — essentially his True Strength Index equipped with a signal line. By smoothing one-bar price changes twice and dividing by the equally-smoothed absolute changes, it produces a clean momentum line that filters bar-to-bar noise while keeping turns relatively timely.
How it is calculated
Each bar's one-bar price change is computed on the chosen source. The changes are smoothed with an EMA of the first period (default 20), then again with an EMA of the second period (default 5); the absolute changes get the same double smoothing. The "smi" line is the ratio of the two — double-smoothed net change divided by double-smoothed total change — so it lives between -1 and +1 (scaled variants use -100..+100). An EMA of the SMI (default 5) forms the "signal" line.
How to read it
The pane shows "smi", its "signal" line, and the "zero" level. SMI near its upper extreme means nearly all recent smoothed movement was upward; near the lower extreme, downward. Above zero is net-bullish momentum, below zero net-bearish. Crosses of "smi" through "signal" are the primary triggers, and the zero line doubles as a trend-bias filter. Divergences against price at extremes carry the usual momentum-fade warning.
What to look for
- Signal-line crossUpside
The "smi" line crosses above its "signal" line.
- Signal-line crossDownside
The "smi" line crosses below its "signal" line.
- Centre-line crossUpside
SMI crosses above zero — double-smoothed momentum has turned net positive.
- Centre-line crossDownside
SMI crosses below zero — momentum has turned net negative.
- DivergenceContext
Price makes a new extreme the SMI does not confirm, hinting the trend's underlying momentum is thinning.
When to use it
The SMI Ergodic suits swing trading on liquid instruments — FX, indexes, large caps, major crypto — on hourly to daily bars, where its double smoothing turns noisy momentum into readable waves. It is most reliable when traded with the zero-line bias (longs on bullish crosses above zero, and vice versa). In tight ranges the smi and signal lines braid around each other near zero and crossovers lose meaning.
Works well with
Settings explained
kPeriod- The first (long) EMA smoothing period applied to the one-bar changes, default 20. It sets the indicator's overall horizon; raising it slows everything down.
dPeriod- The second (short) EMA smoothing period, default 5. It polishes the residual noise left by the first pass; larger values add smoothness and lag.
signalPeriod- The EMA length of the "signal" line, default 5. Shorter gives earlier but more frequent smi/signal crosses.
source- The price field whose one-bar changes are measured; close is standard.
Limitations and common mistakes
- Two EMA passes plus a signal EMA add lag — crosses come after the turn, and later still with larger settings.
- In low-volatility ranges the ratio hovers near zero and produces strings of meaningless crossovers.
- It shares its acronym space with the Stochastic Momentum Index; make sure a reference actually describes Blau's ergodic construction before comparing settings.
References
- Origin: William Blau, 1990s.
- True strength index — Wikipedia (opens in a new tab)
This page explains how an indicator is calculated and read. It describes past data, not what price will do next, and it is not a recommendation to trade. Read the disclaimers.
Try it in Analess
Add SMI Ergodic Oscillator to any chart, adjust its settings, and open this explainer from the indicator itself.