















Indicators · Momentum & oscillators
True Strength Index
A double-smoothed momentum oscillator that reduces noise.
Origin: William Blau, 1991
- Best suited to
- Trending markets
- Responsiveness
- Lagging
- Family
- Momentum & oscillators
What it is
The True Strength Index (TSI) is a double-smoothed momentum oscillator that divides smoothed price change by smoothed absolute price change. The result oscillates around zero, mostly between about -100 and +100 in extreme cases, and tracks momentum direction with far less noise than raw price change.
How it is calculated
Take the bar-to-bar change of the source price. Smooth it with an EMA of the first smoothing period (default 25), then again with the second (default 13); do the same double smoothing to the absolute change. TSI = 100 x (double-smoothed change) / (double-smoothed absolute change). A signal line — an EMA of TSI, default 7 — completes the pane.
How to read it
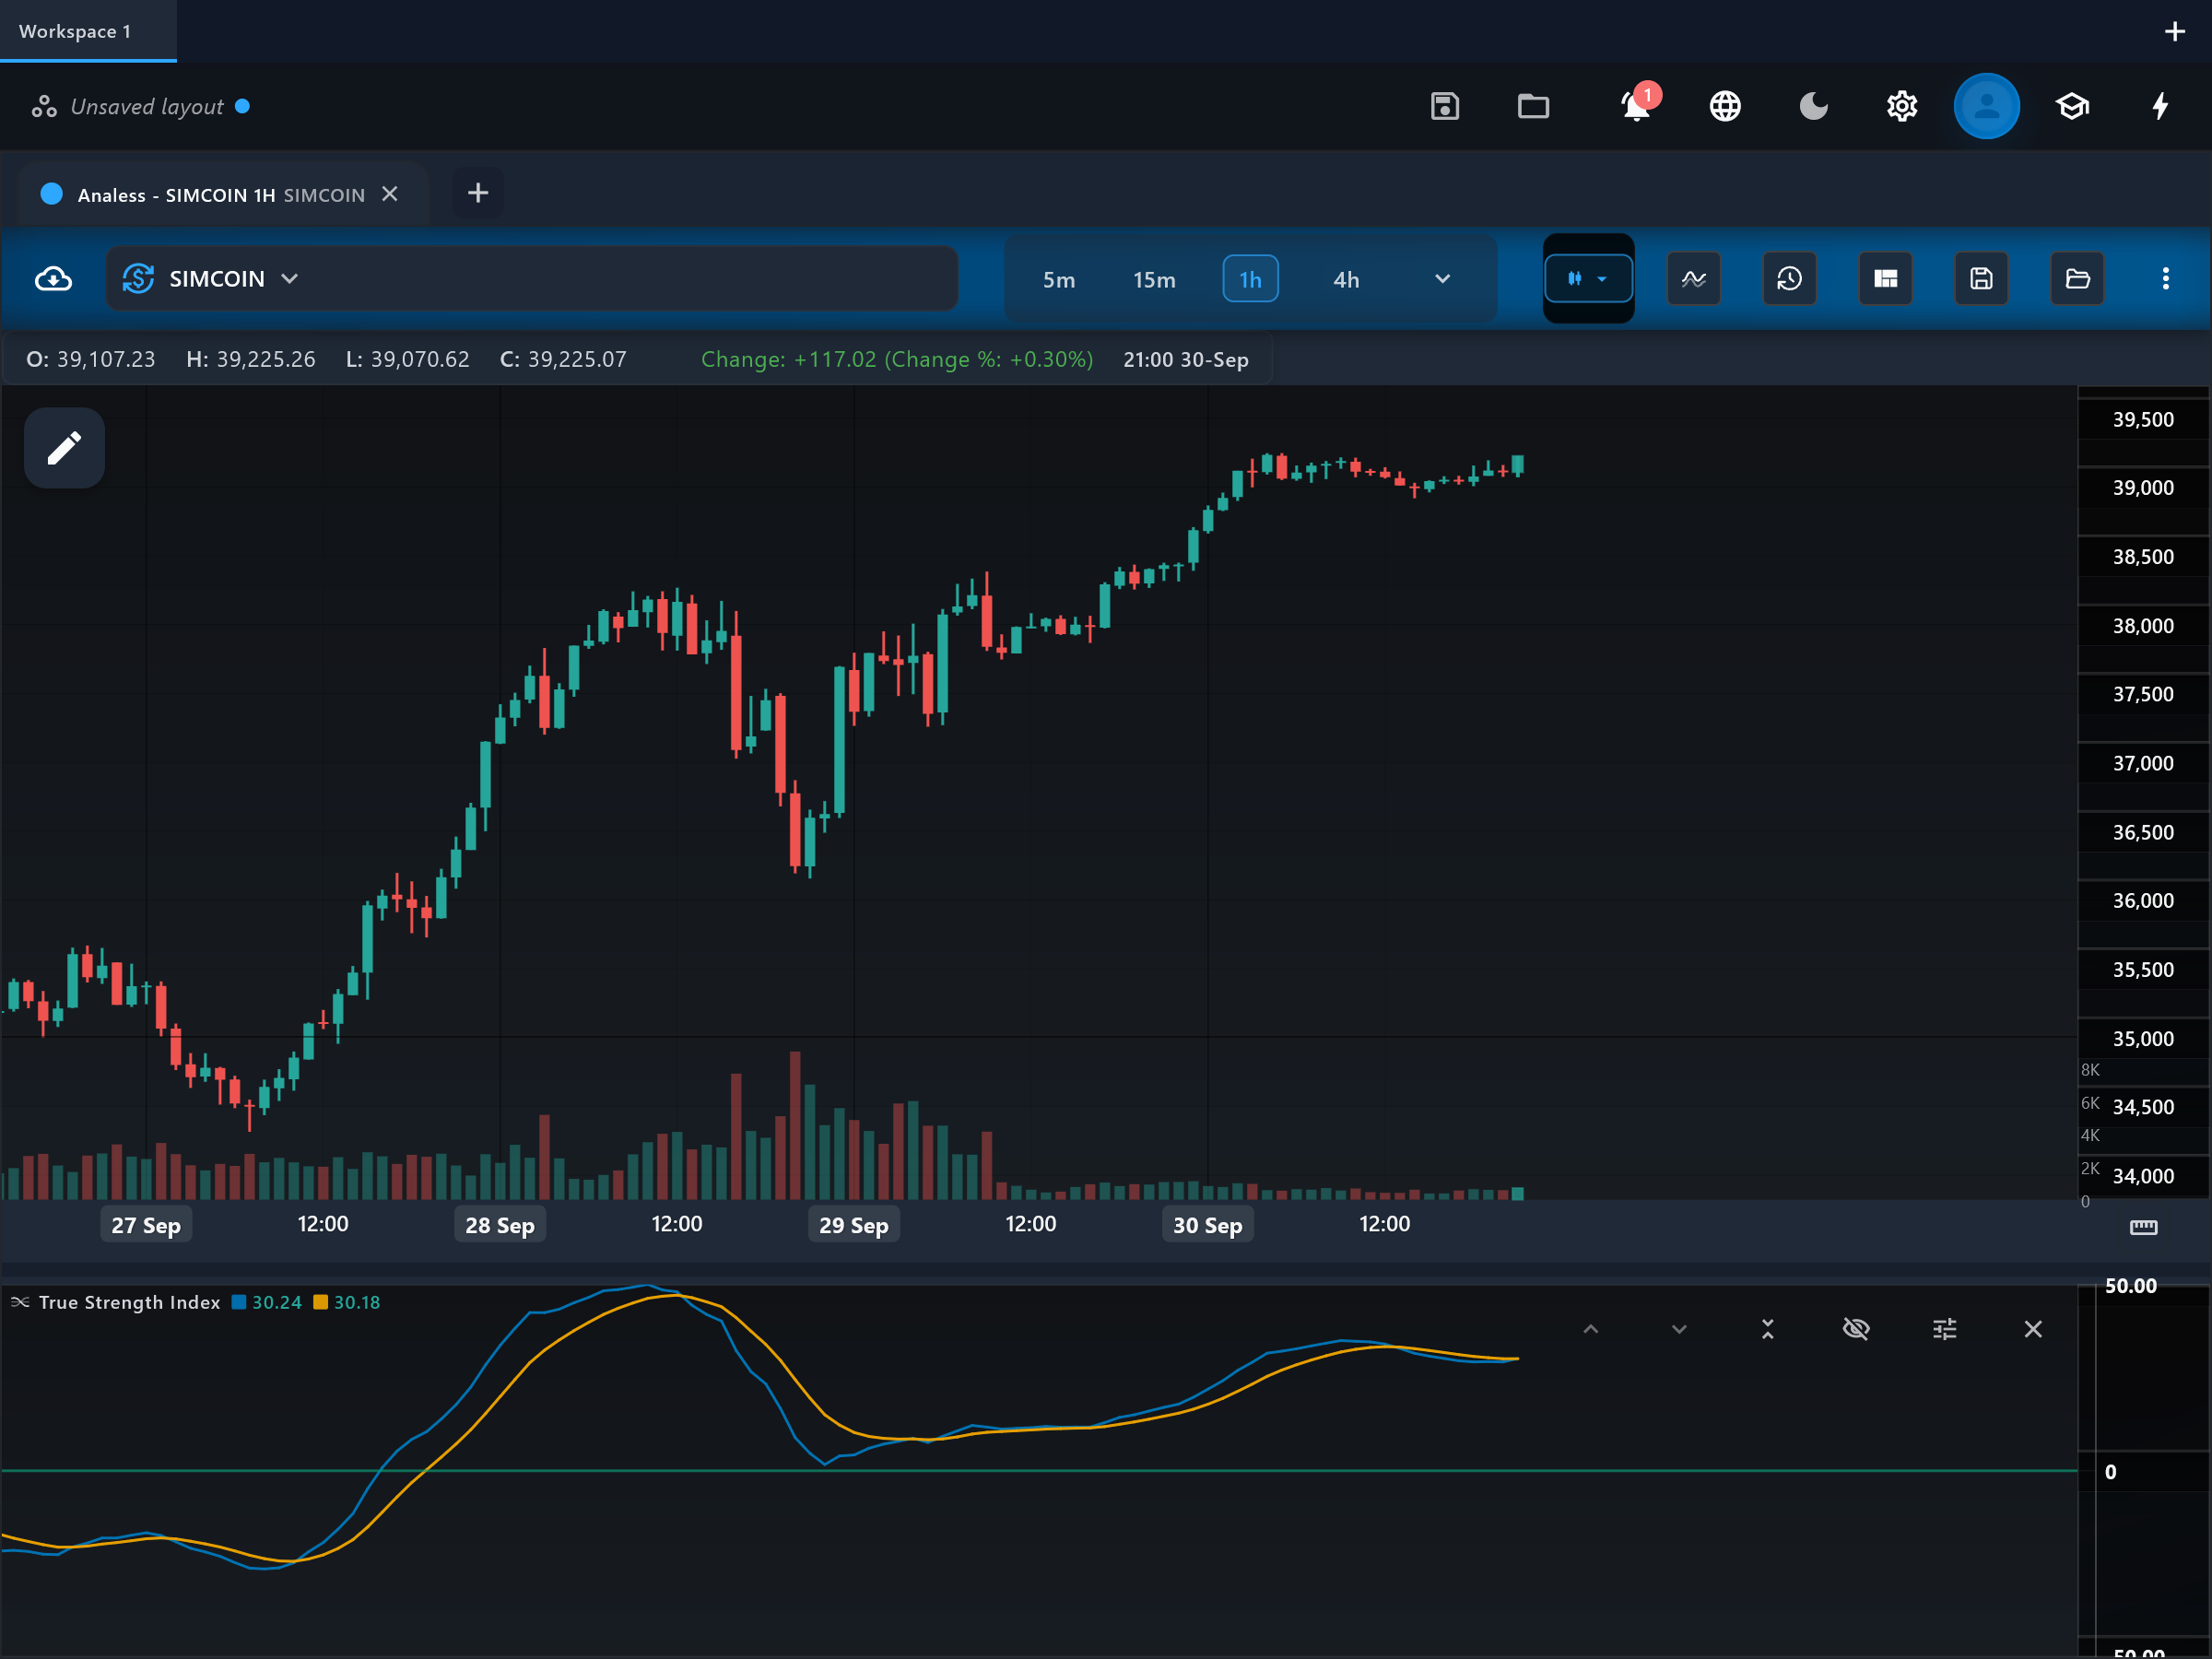
The pane shows the "tsi" line, its "signal" line, and a "zero" reference line. Positive tsi means smoothed momentum is up; negative means down. tsi/signal crosses are the primary trigger, zero crosses the slower trend-direction confirmation. Because of the double smoothing the line is smooth and its swings well defined, which also makes divergences against price relatively easy to spot.
What to look for
- Signal-line crossUpside
tsi crossing above its signal line indicates double-smoothed momentum turning up.
- Signal-line crossDownside
tsi crossing below its signal line indicates double-smoothed momentum turning down.
- Centre-line crossContext
Zero crosses separate sustained positive momentum from sustained negative momentum.
- DivergenceContext
Price highs or lows not confirmed by tsi warn that the smoothed force behind the move is fading.
When to use it
TSI is best on swing timeframes in markets that trend, where its smoothness keeps you on the right side of momentum without constant flips. The long default smoothing (25/13) means meaningful lag — fast reversals and scalping timeframes are a poor fit. In narrow ranges it drifts near zero and its crosses lose significance, like other smoothed momentum tools.
Works well with
Settings explained
firstSmoothing- Default 25 — the first, heavier EMA pass on price change. Lowering it makes TSI markedly faster and noisier; raising it smooths further at the cost of lag.
secondSmoothing- Default 13 — the second EMA pass. Fine-tunes smoothness; lower for quicker turns, higher for a steadier line.
signalPeriod- Default 7 — the EMA of tsi that forms the signal line. Lower values give earlier crosses, higher values fewer whipsaws.
source- Default close — the price series whose bar-to-bar changes feed the calculation.
Limitations and common mistakes
- Double smoothing means signals arrive late relative to the actual turn.
- Not strictly bounded — extreme values vary by market, so fixed overbought/oversold levels are unreliable.
- Drifts uselessly near zero in tight ranges.
References
- Origin: William Blau, 1991.
- True strength index — Wikipedia (opens in a new tab)
This page explains how an indicator is calculated and read. It describes past data, not what price will do next, and it is not a recommendation to trade. Read the disclaimers.
Try it in Analess
Add True Strength Index to any chart, adjust its settings, and open this explainer from the indicator itself.