















Indicators · Momentum & oscillators
Stochastic RSI
Applies the stochastic formula to RSI for a more sensitive momentum read.
Origin: Tushar Chande and Stanley Kroll, 1994
- Best suited to
- Ranging markets
- Responsiveness
- Leading
- Family
- Momentum & oscillators
What it is
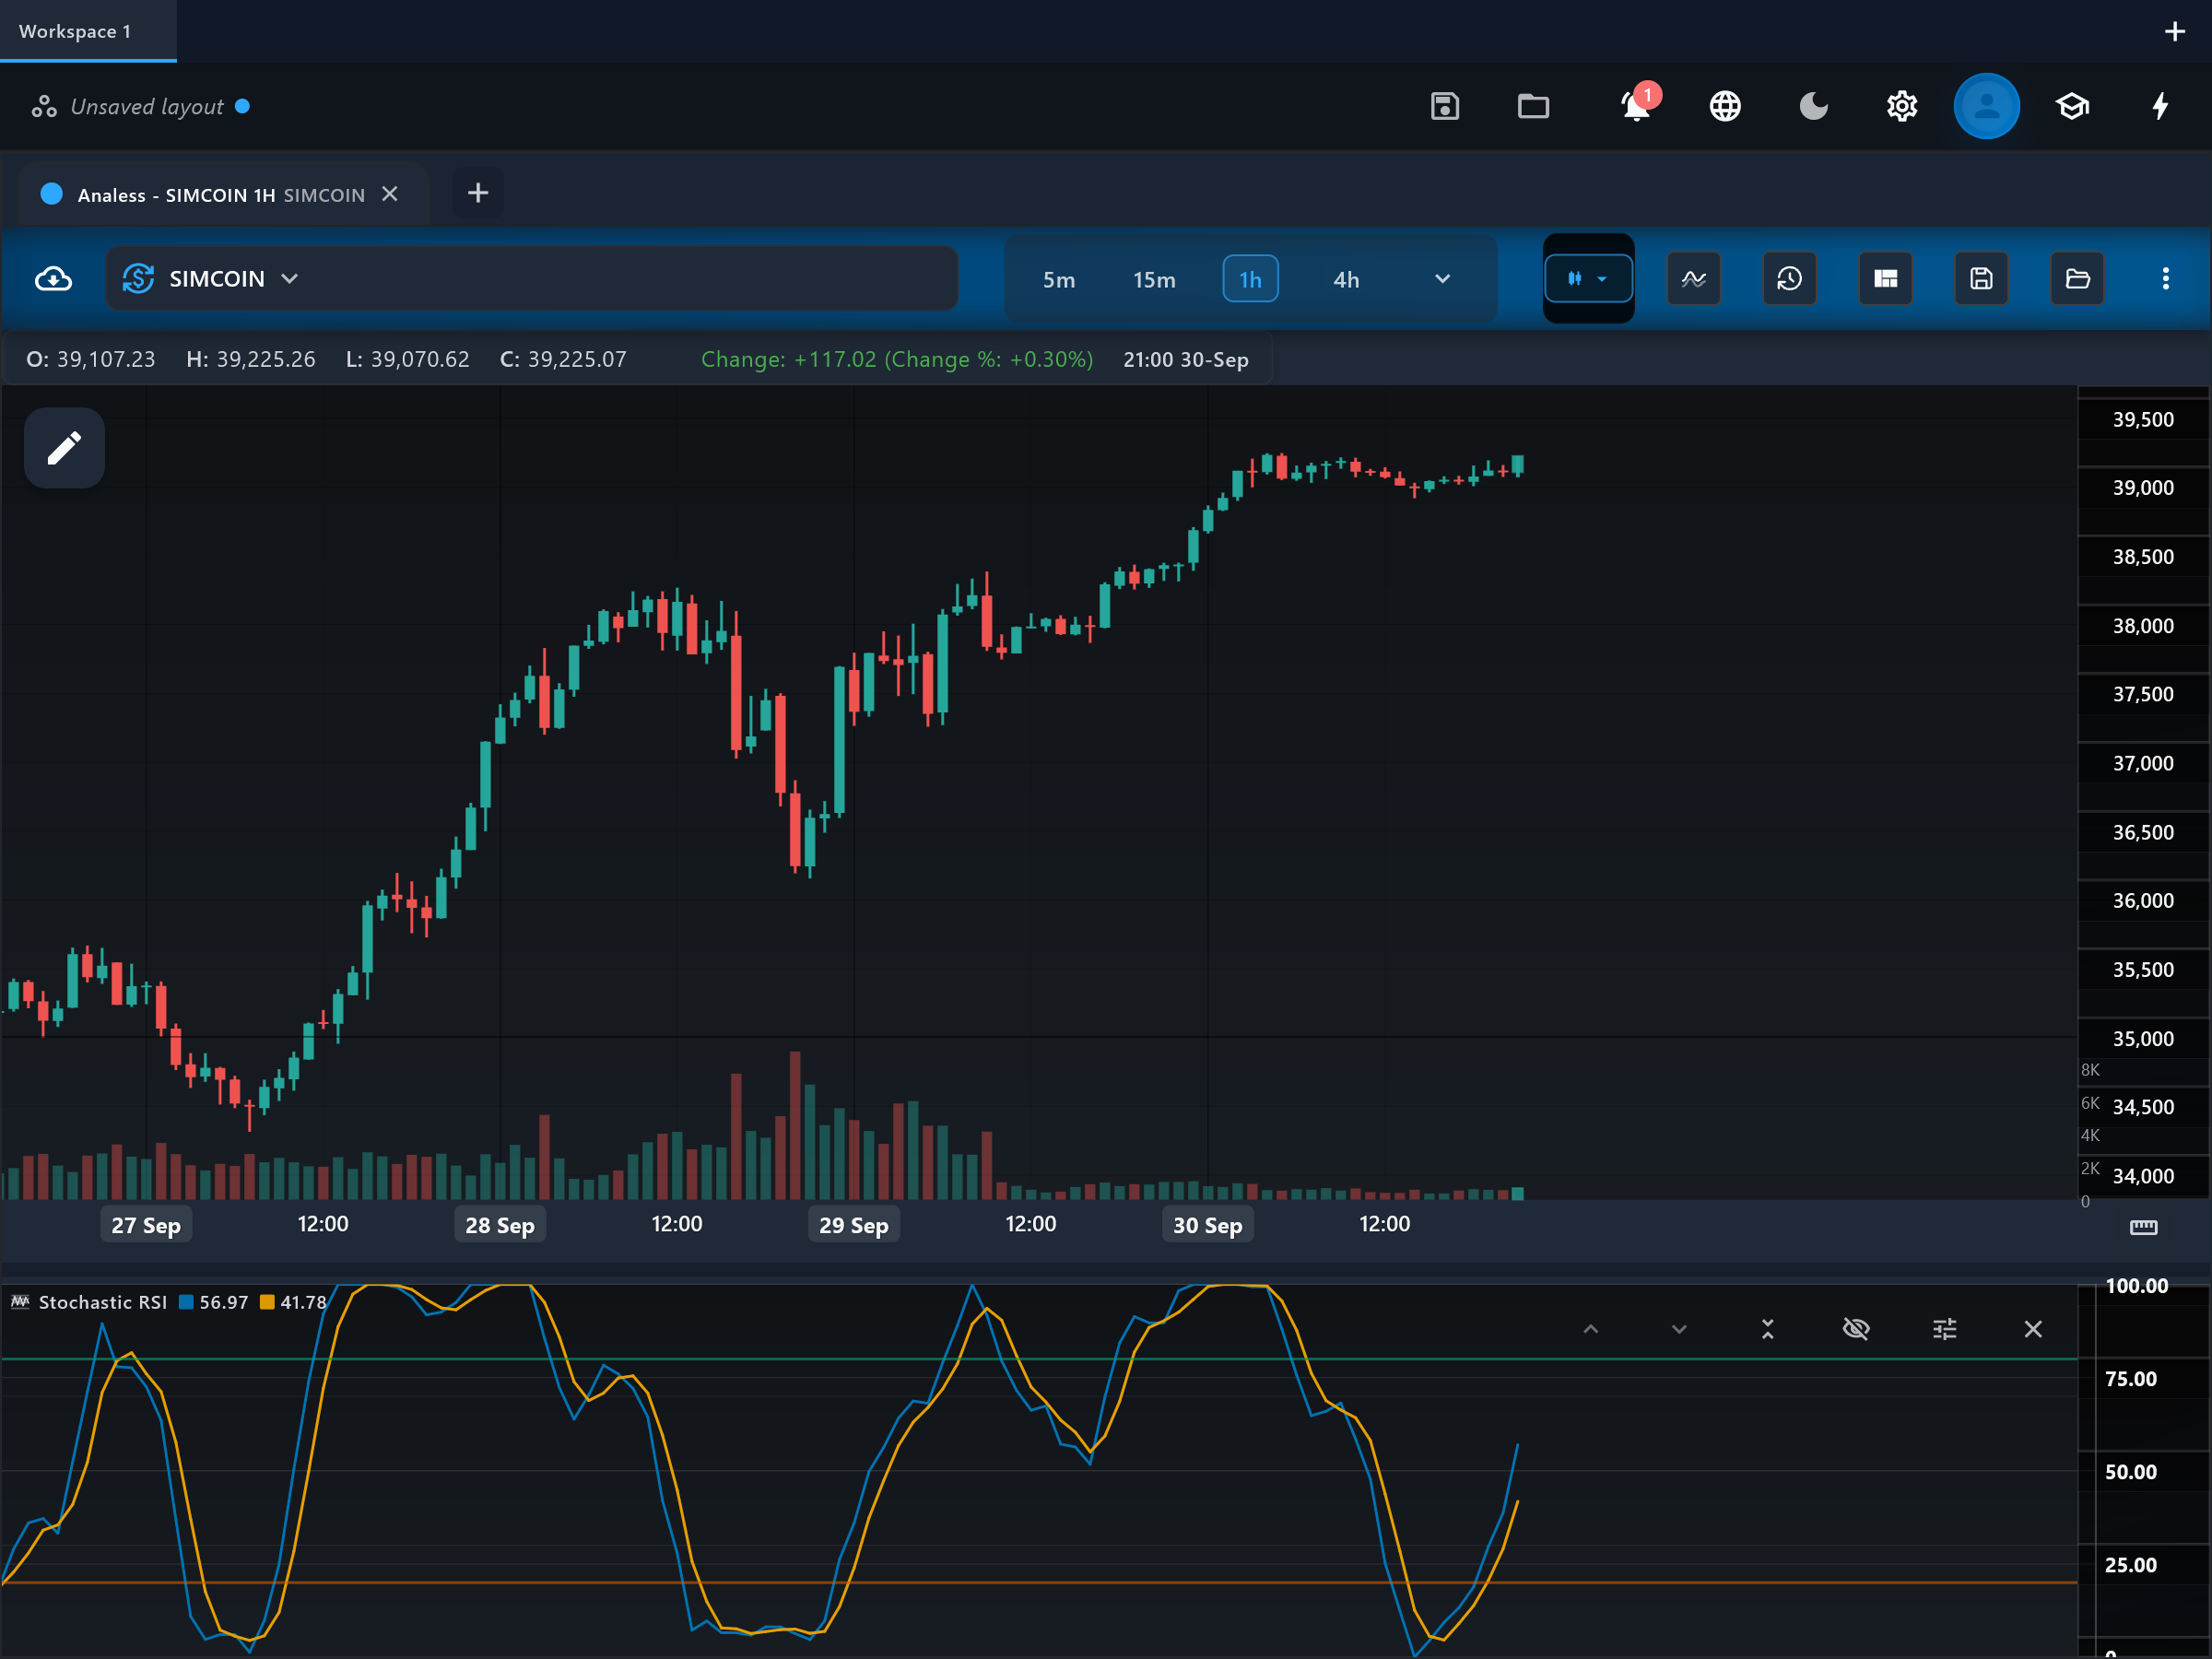
Stochastic RSI applies the stochastic formula to RSI values instead of price, creating an "indicator of an indicator". It measures where RSI sits within its own recent range, which makes it far more sensitive than plain RSI — it reaches its extremes much more often.
How it is calculated
First RSI is computed on the chosen source over the RSI period. Then the stochastic formula is applied to that RSI series: (RSI - lowest RSI) / (highest RSI - lowest RSI) over the %K period, scaled to 0-100. The result is smoothed with a simple moving average of length "smooth K" to give the k line, and k is averaged again over "smooth D" to give the d line.
How to read it
The pane shows the "k" and "d" lines between "overbought" (default 80) and "oversold" (default 20) guides. Because it is a stochastic of RSI, the lines swing to the extremes quickly and often — a reading of 100 just means RSI is at the top of its own recent range, not that price is at a high. Read k/d crosses and zone exits the same way as the regular stochastic, but expect many more of them.
What to look for
- Overbought / oversoldContext
Above 80, RSI is near the top of its recent range; below 20, near the bottom. Because sensitivity is high, these zones are hit frequently and need confirmation.
- Signal-line crossUpside
k crossing above d from the oversold zone signals RSI momentum turning up.
- Signal-line crossDownside
k crossing below d from the overbought zone signals RSI momentum turning down.
When to use it
Stochastic RSI suits active traders on liquid markets who find plain RSI too slow — it generates early, frequent readings on intraday and swing timeframes. Like all bounded oscillators it misleads in strong trends, staying pinned at an extreme while the move continues, and its extra sensitivity makes that worse. Avoid using it alone in trending conditions; filter its signals with a trend indicator.
Works well with
Settings explained
rsiPeriod- Default 14 — the underlying RSI lookback. Lowering it makes the base RSI (and everything downstream) faster; raising it slows the whole indicator.
kPeriod- Default 14 — how many bars of RSI history define the range the stochastic is measured against. Shorter windows reach 0 and 100 more often; longer windows make extremes rarer.
smoothK- Default 3 — SMA smoothing applied to the raw stochastic to form the k line. Raise it to calm the notoriously jumpy raw values; 1 leaves them unsmoothed.
smoothD- Default 3 — SMA of k that forms the d signal line. Higher values give fewer, later k/d crosses.
source- Default close — the price series the underlying RSI is computed from.
overboughtLevel- Default 80 — the upper guide level drawn on the pane. Tighten it for choppier markets, loosen it for strong trends.
oversoldLevel- Default 20 — the lower guide level drawn on the pane. Tighten it for choppier markets, loosen it for strong trends.
Limitations and common mistakes
- Extremely sensitive: it flips between extremes far more often than RSI, so raw zone touches are weak evidence on their own.
- It measures RSI's range position, not price's — a reading of 100 can occur while price is barely moving.
- Two layers of smoothing and two lookbacks make its behavior very settings-dependent.
References
- Origin: Tushar Chande and Stanley Kroll, 1994.
- Stochastic oscillator — Wikipedia (opens in a new tab)
This page explains how an indicator is calculated and read. It describes past data, not what price will do next, and it is not a recommendation to trade. Read the disclaimers.
Try it in Analess
Add Stochastic RSI to any chart, adjust its settings, and open this explainer from the indicator itself.