















Indicators · Moving averages
Triple Moving Average
Three moving averages of increasing length to read short-, medium-, and long-term trend at once.
Origin: Classical construct—no single originator
- Best suited to
- Trending markets
- Responsiveness
- Lagging
- Family
- Moving averages
What it is
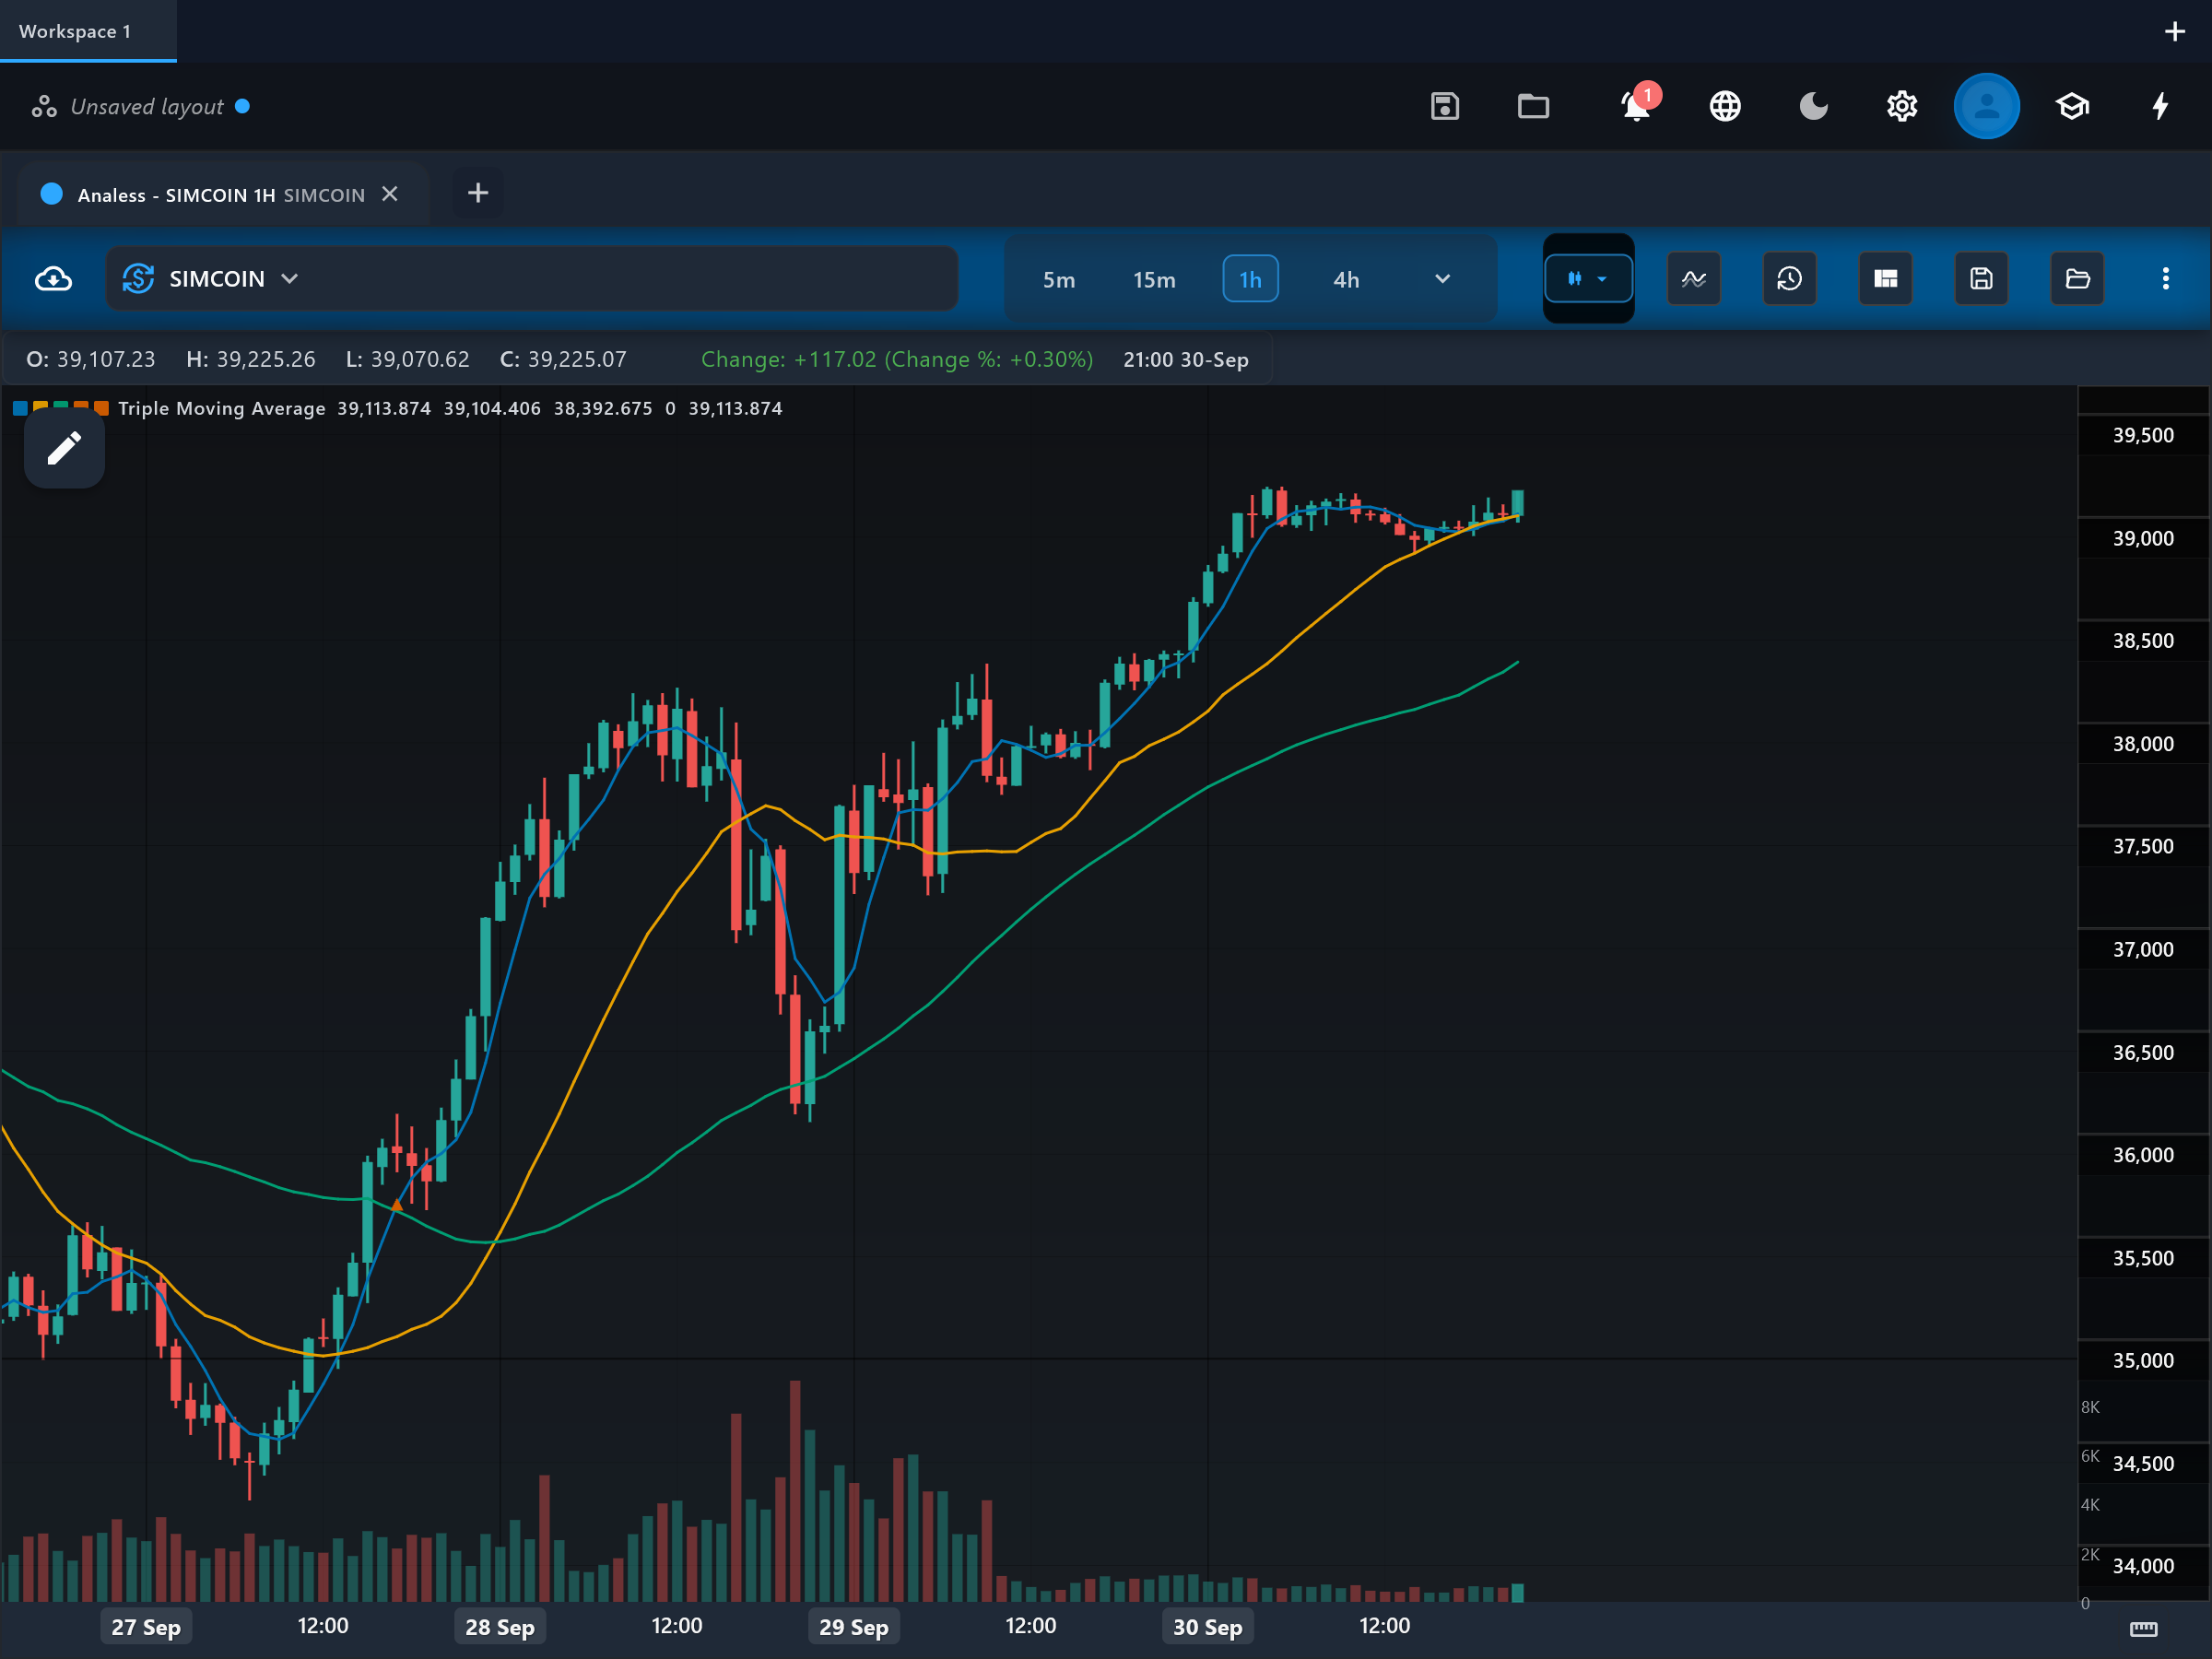
The triple moving average plots a fast, medium and slow moving average together, giving a three-speed view of the trend. The extra middle line acts as a filter that helps distinguish genuine trend changes from short-lived noise.
How it is calculated
Three moving averages of the same price source are computed over fastPeriod, mediumPeriod and slowPeriod bars, each with its own method (simple, exponential, weighted or linear regression endpoint). The indicator additionally marks each bar where the fast average crosses the slow average — the medium line is drawn for context and alignment but is not part of the marked cross.
How to read it
Four plots appear on the price chart: fast_ma, medium_ma, slow_ma, and crossover_signal markers where fast_ma crosses slow_ma. The strongest trends show full alignment — fast above medium above slow in an uptrend, the reverse in a downtrend — with the lines fanning apart. When the three lines compress and tangle, the market is consolidating and crossover signals lose reliability. A fast/slow cross that happens while the medium line already points the same way is generally considered higher quality.
What to look for
- Signal-line crossUpside
fast_ma crosses above slow_ma, ideally with medium_ma already rising between them — a filtered uptrend entry.
- Signal-line crossDownside
fast_ma crosses below slow_ma with medium_ma turning down — a filtered downtrend signal.
- Trend filterContext
Full stacking of the three lines (fast over medium over slow, or the inverse) is a trend-strength filter; mixed ordering means no clear trend.
- ConfirmationContext
Price pulling back to medium_ma and holding while the stack stays intact tends to confirm trend continuation.
When to use it
Three-average systems suit trending markets on swing and position timeframes — daily stocks, indices, major forex pairs and large-cap crypto. The classic 4/9/18 and this app default 5/20/50 are common starting points. Avoid the system during tight consolidations: three tangled lines produce even more conflicting signals than two.
Works well with
Settings explained
fastPeriod- Default 5. Lowering it gives the earliest possible cross signals but the most noise; raising it slows the trigger line.
mediumPeriod- Default 20. This is the filter line — raising it demands a longer-lasting move before the stack aligns; lowering it makes alignment easier and the filter weaker.
slowPeriod- Default 50. Defines the baseline trend. Raising it targets longer trends with fewer, later signals; lowering it shortens the horizon of the whole system.
fastMethod- Default simple. Exponential or weighted makes the fast line snap to price sooner and shifts crosses earlier.
mediumMethod- Default simple. Changing the medium method mostly alters how quickly the filter line confirms a new direction.
slowMethod- Default simple. A faster method here reduces overall lag but makes the baseline trend flip more often.
source- Default close. All three averages use this price field; close is the conventional choice.
Limitations and common mistakes
- Three lags compound: full alignment often arrives well after the trend has begun.
- In consolidations the lines braid together and the crossover markers whipsaw.
- More lines mean more subjective judgement — traders can always find one line that supports their bias.
References
- Origin: Classical construct—no single originator.
- Moving average — Wikipedia (opens in a new tab)
This page explains how an indicator is calculated and read. It describes past data, not what price will do next, and it is not a recommendation to trade. Read the disclaimers.
Try it in Analess
Add Triple Moving Average to any chart, adjust its settings, and open this explainer from the indicator itself.