















Indicators · Momentum & oscillators
TRIX
The rate of change of a triple-smoothed moving average, filtering out minor moves.
Origin: Jack Hutson, 1980s
- Best suited to
- Trending markets
- Responsiveness
- Lagging
- Family
- Momentum & oscillators
What it is
TRIX is the one-bar rate of change of a triple-smoothed exponential moving average, designed to show the momentum of the underlying trend with most short-term noise filtered out. Three rounds of EMA smoothing suppress moves shorter than the chosen period, so what remains reflects the dominant cycle.
How it is calculated
Price is smoothed with an EMA three times in a row (same period, default 14), then the one-bar percentage change of that triple EMA is taken; in this app the result is scaled to basis points (hundredths of a percent). A signal line — an EMA of TRIX, default 9 — is added for crossover reading, like a heavily smoothed MACD.
How to read it
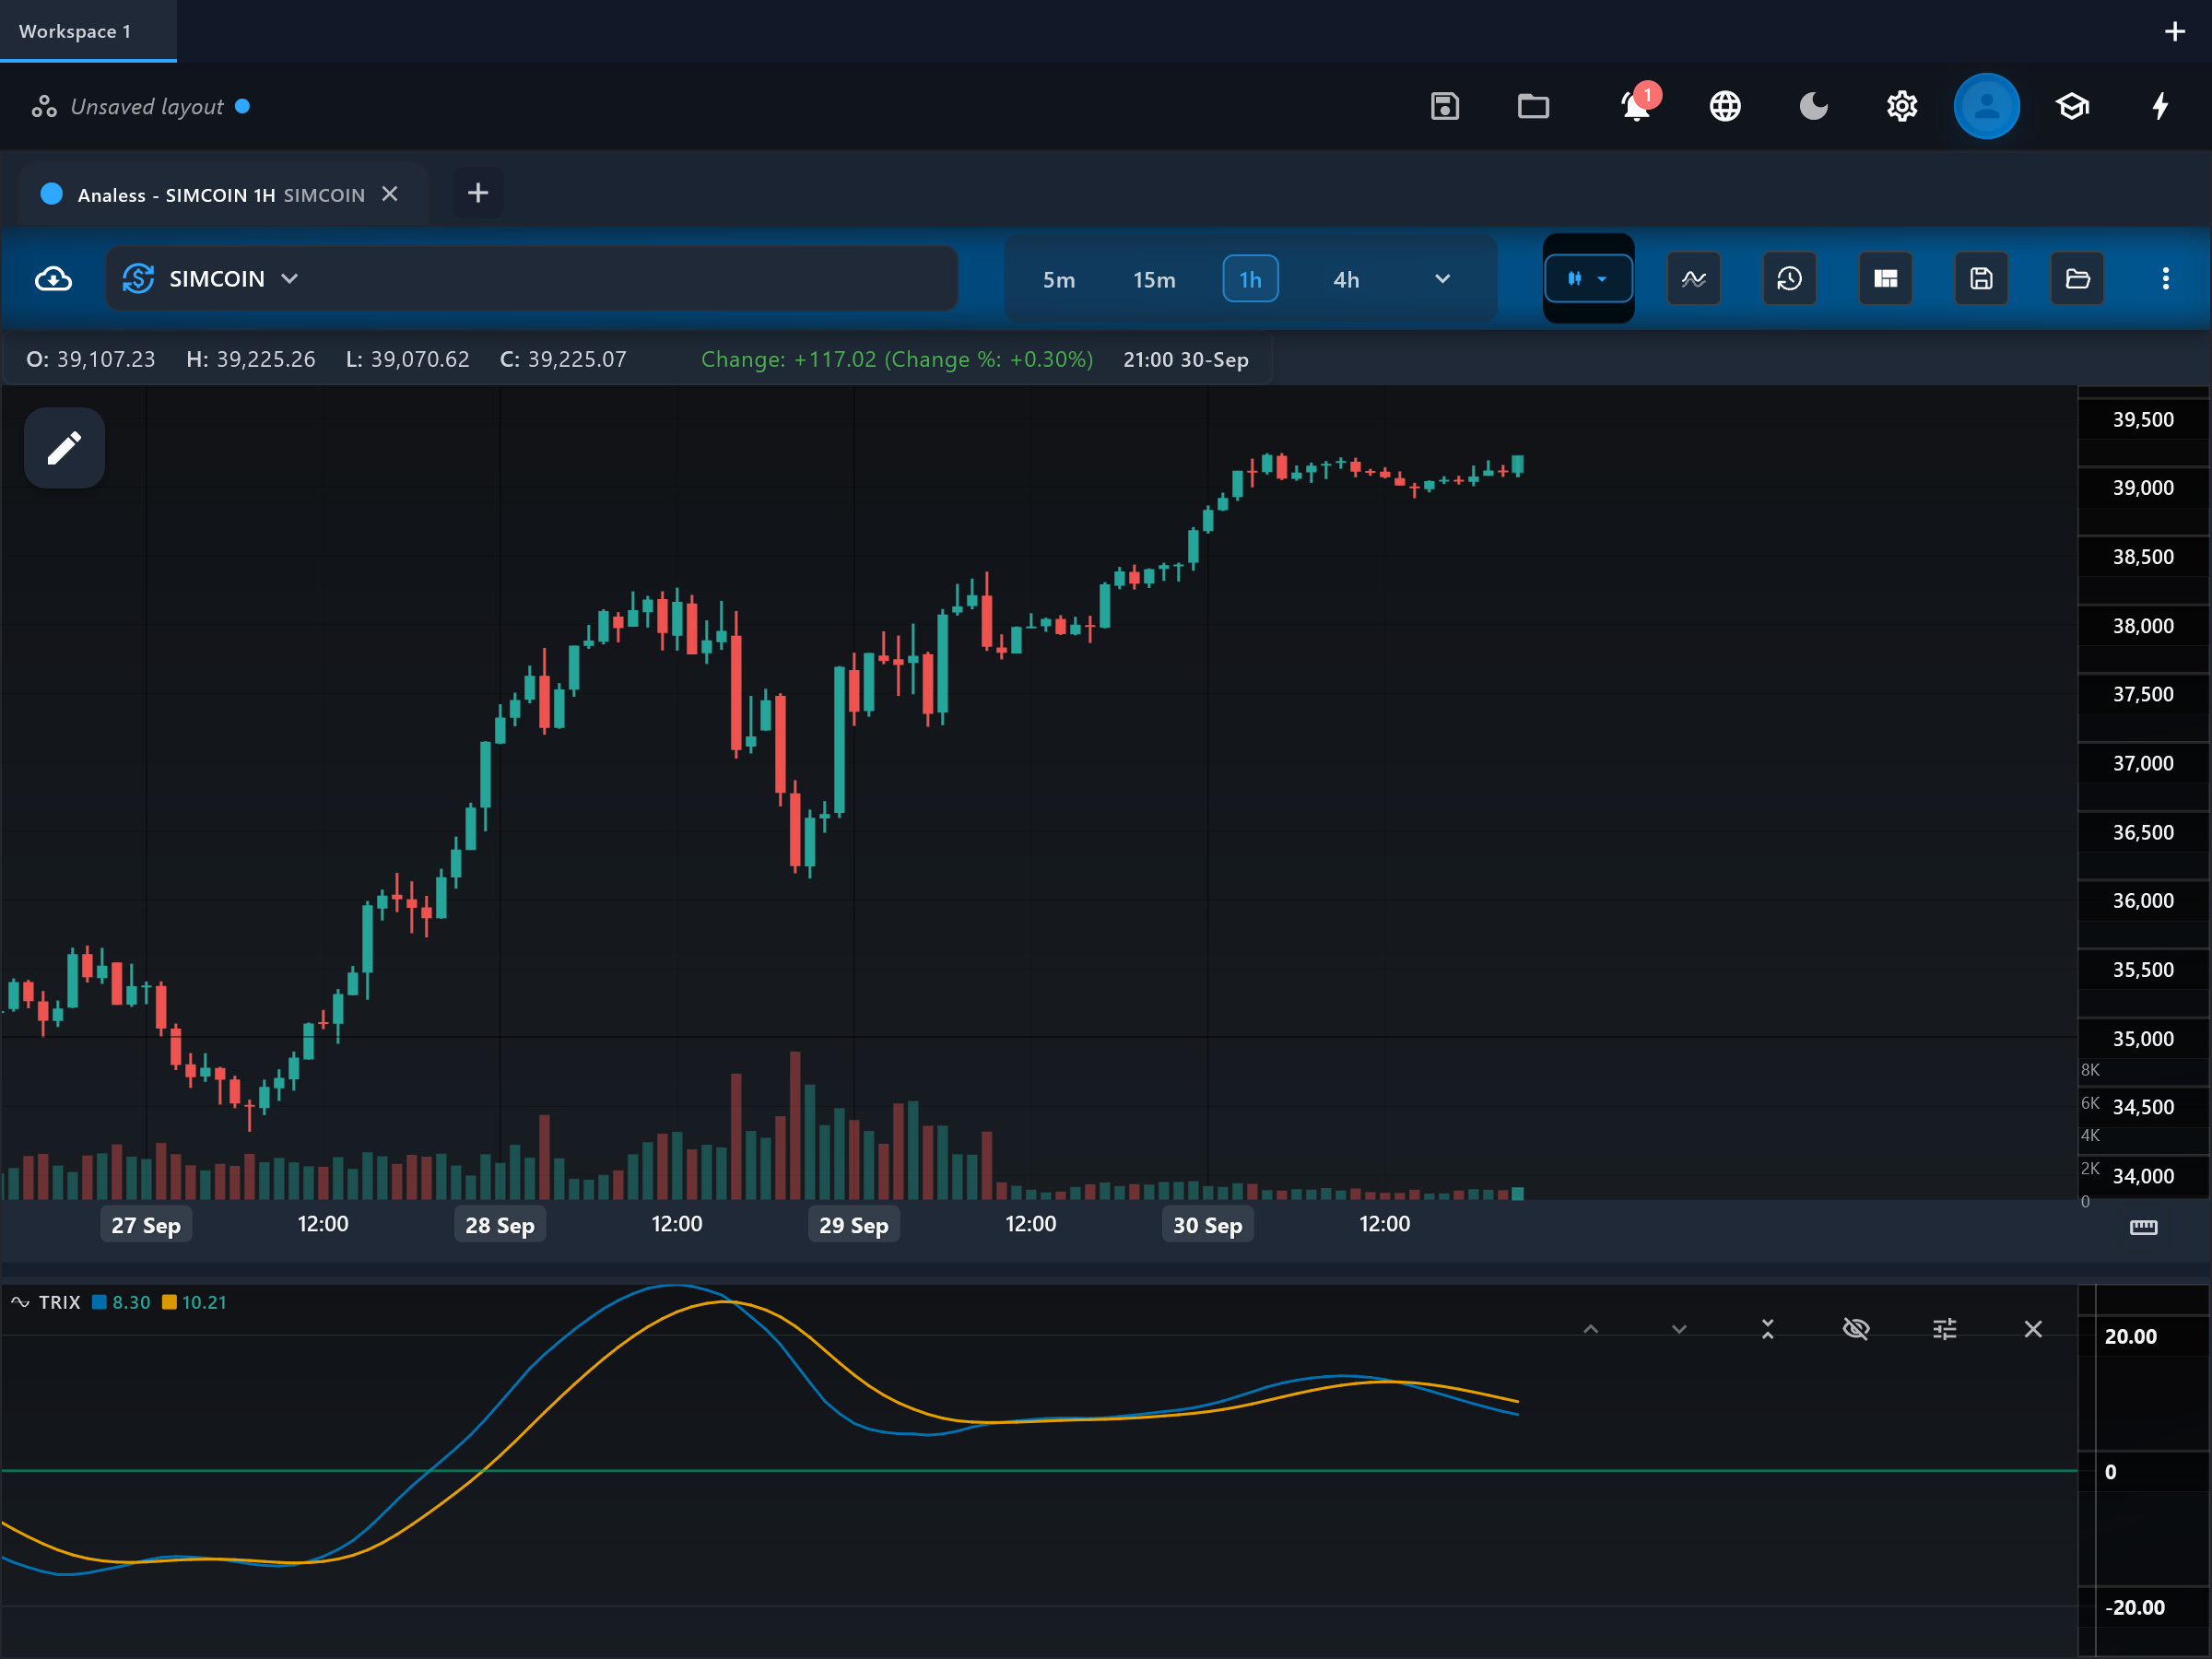
The pane shows the "trix" line, its "signal" line, and a "zero" reference line. trix above zero means the triple-smoothed trend is rising; below zero, falling. Crosses of trix over its signal line are the faster trigger, and zero-line crosses the slower, trend-level one. Because of the heavy smoothing, the line turns gradually — direction changes in trix itself are meaningful events, not noise.
What to look for
- Signal-line crossUpside
trix crossing above its signal line indicates smoothed momentum turning up.
- Signal-line crossDownside
trix crossing below its signal line indicates smoothed momentum turning down.
- Centre-line crossContext
Zero crosses mark the triple-smoothed trend itself changing direction — rare and slow, but significant.
- DivergenceContext
Price extremes without matching trix extremes suggest the trend is advancing on fading core momentum.
When to use it
TRIX suits swing and position traders on trending markets who want signals only when the underlying trend actually shifts, and its noise filtering is valuable on volatile instruments. The cost is lag: three EMAs plus a rate of change means TRIX confirms turns well after they start, so it is a poor scalping tool and sluggish in fast reversals. In tight ranges it flatlines near zero and its crosses carry little information.
Works well with
Settings explained
period- Default 14 — the period used by all three EMA passes. Lower values (9 or less) let shorter cycles through and speed up signals; higher values (18+) filter more and lag more.
signalPeriod- Default 9 — the EMA of the trix line. Lower it for earlier signal crosses; raise it to cut whipsaws further.
source- Default close — the price series fed into the first EMA pass.
Limitations and common mistakes
- Heavy lag by construction — turns are confirmed late.
- Near-useless in flat ranges, where it hugs zero.
- Values are tiny (basis points), so read shape and crosses, not absolute magnitude.
References
- Origin: Jack Hutson, 1980s.
- Trix (technical analysis) — Wikipedia (opens in a new tab)
This page explains how an indicator is calculated and read. It describes past data, not what price will do next, and it is not a recommendation to trade. Read the disclaimers.
Try it in Analess
Add TRIX to any chart, adjust its settings, and open this explainer from the indicator itself.