















Indicators · Momentum & oscillators
Ultimate Oscillator
Blends momentum across three timeframes into a single measure.
Origin: Larry Williams, 1976
- Best suited to
- Ranging markets
- Responsiveness
- Leading
- Family
- Momentum & oscillators
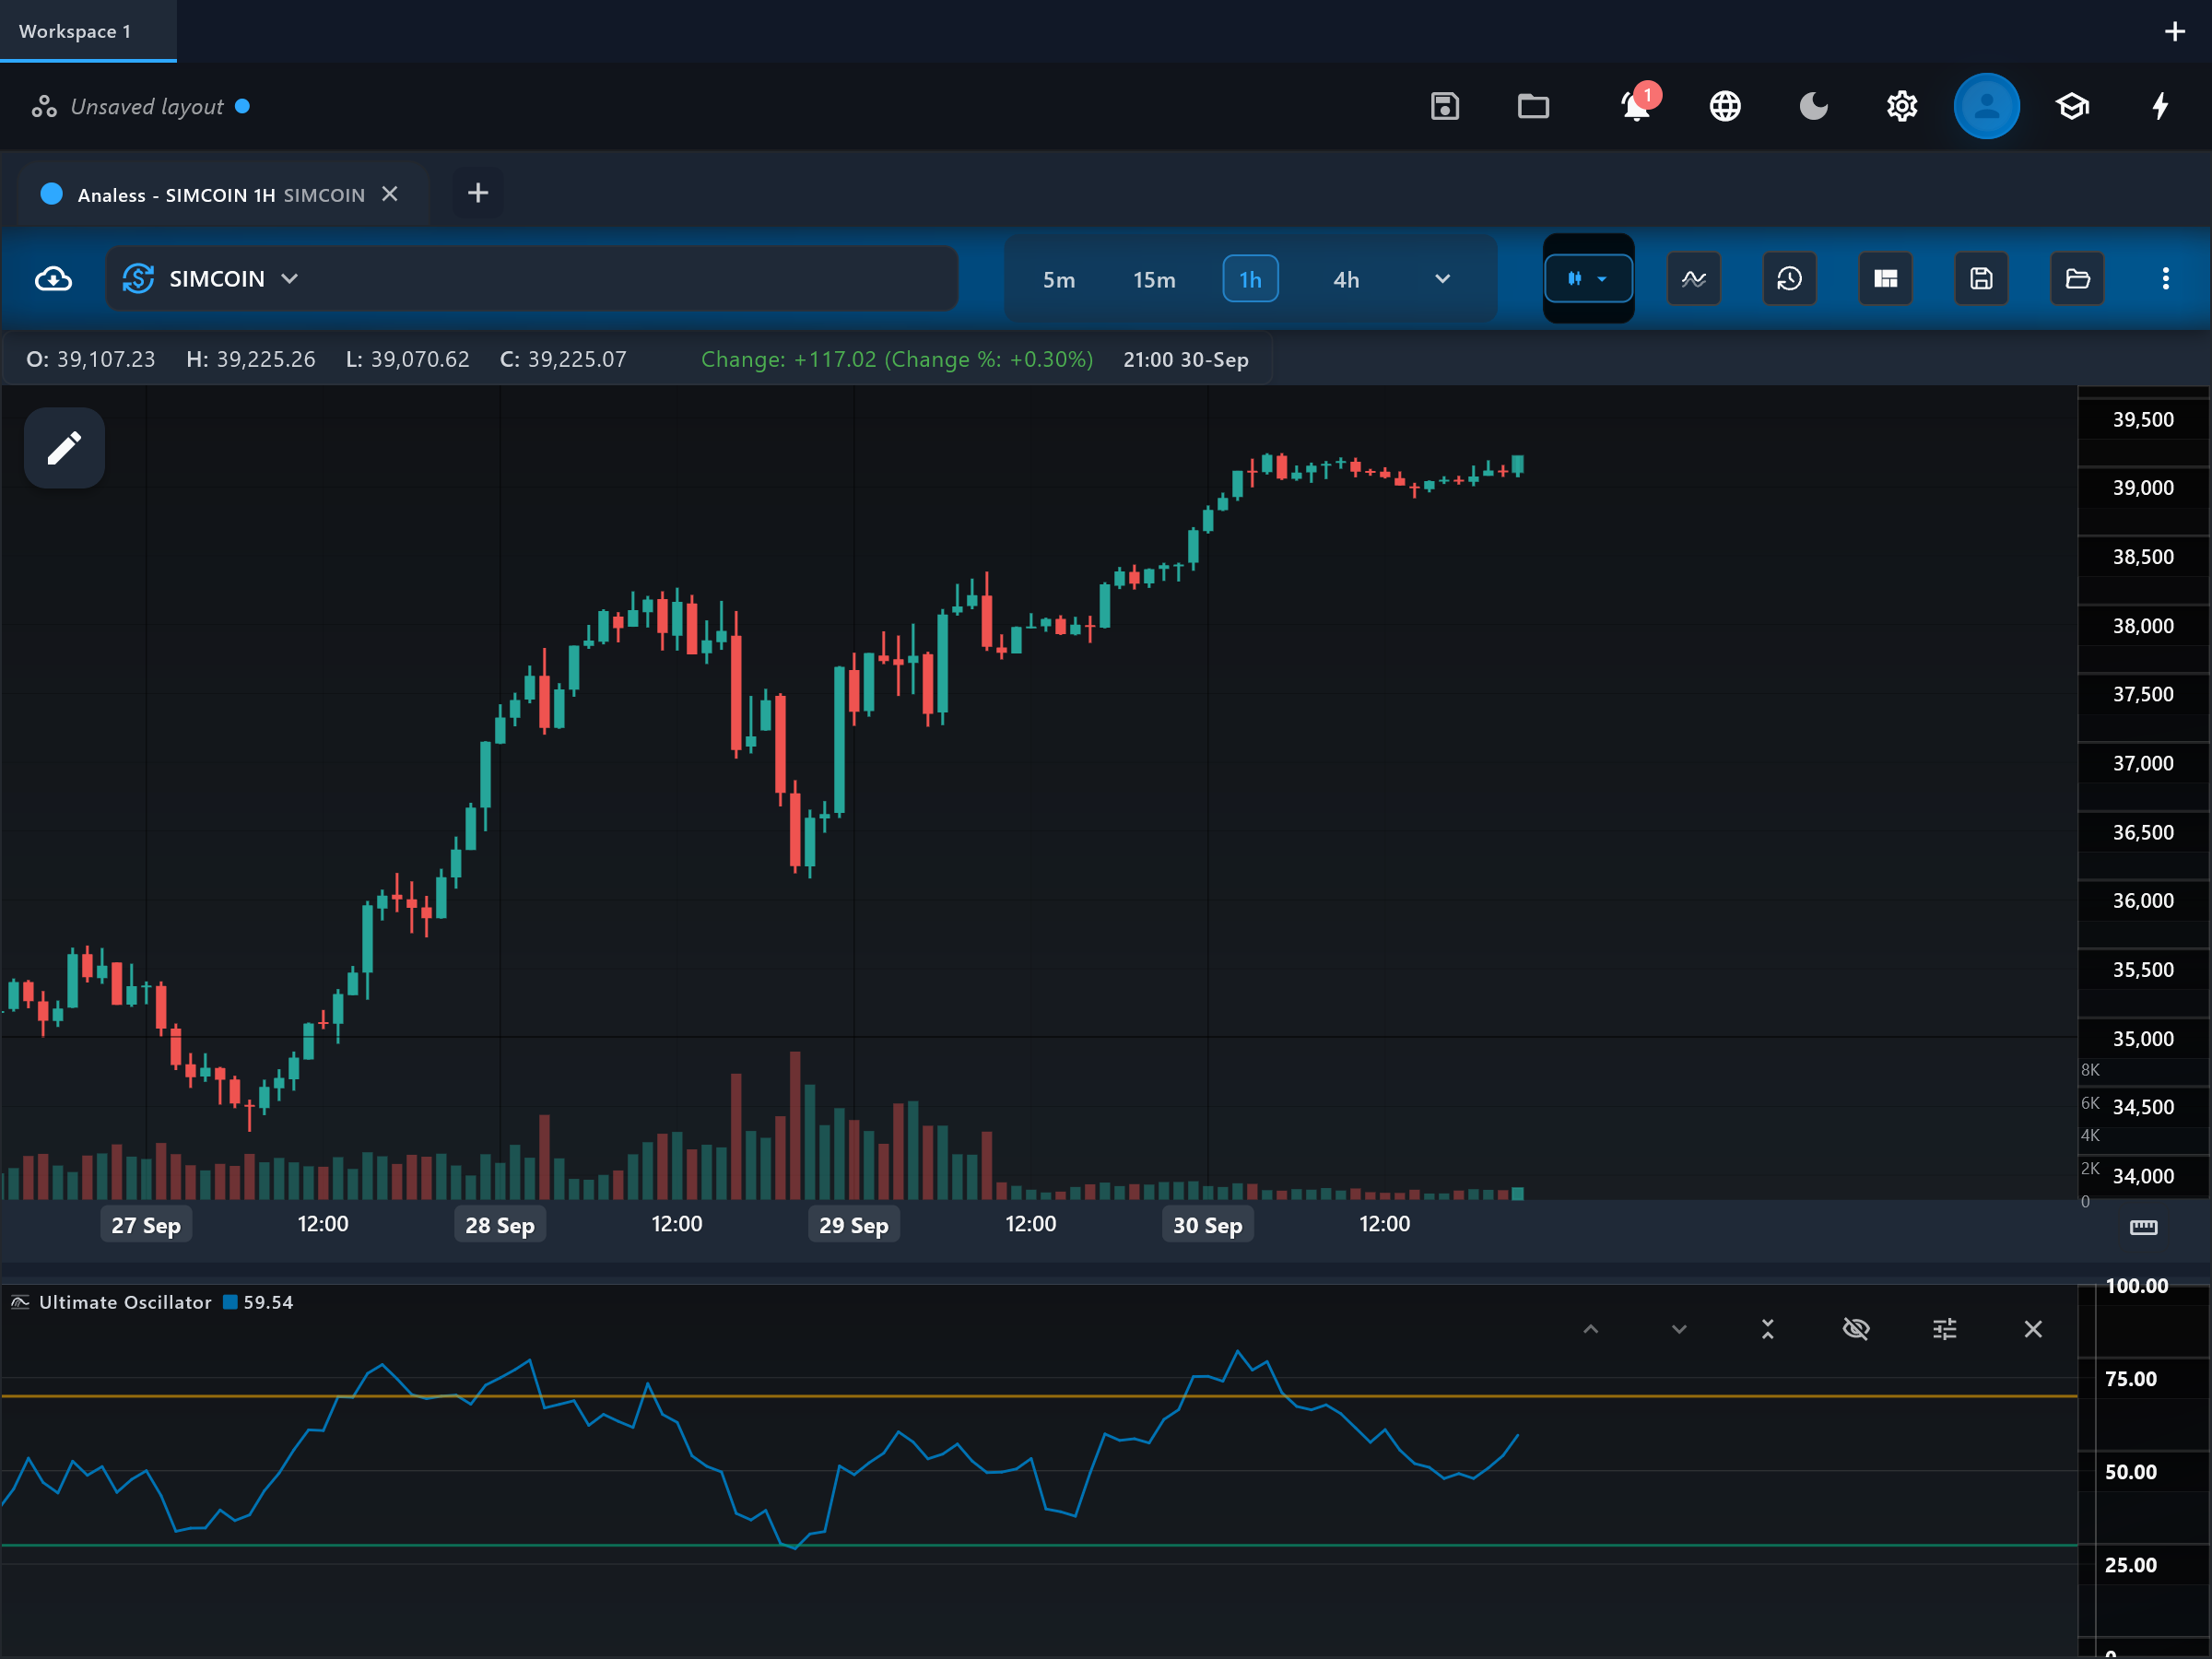
What it is
The Ultimate Oscillator combines buying pressure measured over three different lookback windows — short, medium, and long — into one 0-100 reading. Williams designed it to avoid the classic single-period oscillator flaw of flagging divergences that fail because they only reflect one timeframe.
How it is calculated
For each bar, buying pressure = close - true low, and true range = true high - true low. These are summed over the three periods (defaults 7, 14, 28) and each sum ratio is weighted 4, 2, and 1 respectively — the short window counts most. The weighted average is scaled to 0-100.
How to read it
The pane shows the "uo" line with "overbought" (default 70) and "oversold" (default 30) guide lines. High readings mean closes have sat near the top of their true ranges across all three windows; low readings the reverse. Williams' original method centers on divergences: a bullish divergence below 30 followed by a break above the divergence high, rather than simple zone touches. The 50 area acts as the neutral midpoint.
What to look for
- DivergenceUpside
Williams' setup: price makes a lower low while uo makes a higher low with the first low under 30, then uo breaks above the high set during the divergence.
- DivergenceDownside
The mirror setup: a higher price high with a lower uo high above 70, confirmed when uo breaks the divergence low.
- Overbought / oversoldContext
Above 70 or below 30 buying pressure is stretched across all three windows — context for the divergence setups more than a standalone trigger.
When to use it
The Ultimate Oscillator works on any liquid market with daily and intraday bars, and its multi-window design makes its divergences more selective than single-period oscillators. It is still a bounded oscillator, so in a strong trend it will hold elevated or depressed levels and mislead anyone fading them. Its strict three-step divergence signal is genuinely rare — expect long waits between textbook setups.
Works well with
Settings explained
period1- Default 7 — the short window, weighted 4x (dominant). Lowering it makes the oscillator noticeably faster; raising it dampens short-term swings.
period2- Default 14 — the medium window, weighted 2x. Adjust to shift how much the intermediate swing contributes.
period3- Default 28 — the long window, weighted 1x. Raising it anchors the reading to a longer trend context.
overboughtLevel- The upper guide line (default 70, Williams' original threshold). Tighten it toward 65 in choppier markets; loosen it in strong trends where the oscillator rides high.
oversoldLevel- The lower guide line (default 30). Williams' buy setup requires the divergence low to form below this line.
Limitations and common mistakes
- The full three-step divergence signal is rare, so the indicator gives few actionable setups.
- Bounded 0-100 scale means it pins at extremes during strong trends.
- Three periods and fixed 4/2/1 weights make its behavior harder to reason about than single-window oscillators.
References
- Origin: Larry Williams, 1976.
- Ultimate oscillator — Wikipedia (opens in a new tab)
This page explains how an indicator is calculated and read. It describes past data, not what price will do next, and it is not a recommendation to trade. Read the disclaimers.
Try it in Analess
Add Ultimate Oscillator to any chart, adjust its settings, and open this explainer from the indicator itself.