















Indicators · Volume
Volume Oscillator
The difference between a fast and slow volume average, showing whether volume is rising or falling.
Origin: Classical volume construct—no single originator
- Best suited to
- Any market condition
- Responsiveness
- Coincident
- Family
- Volume
What it is
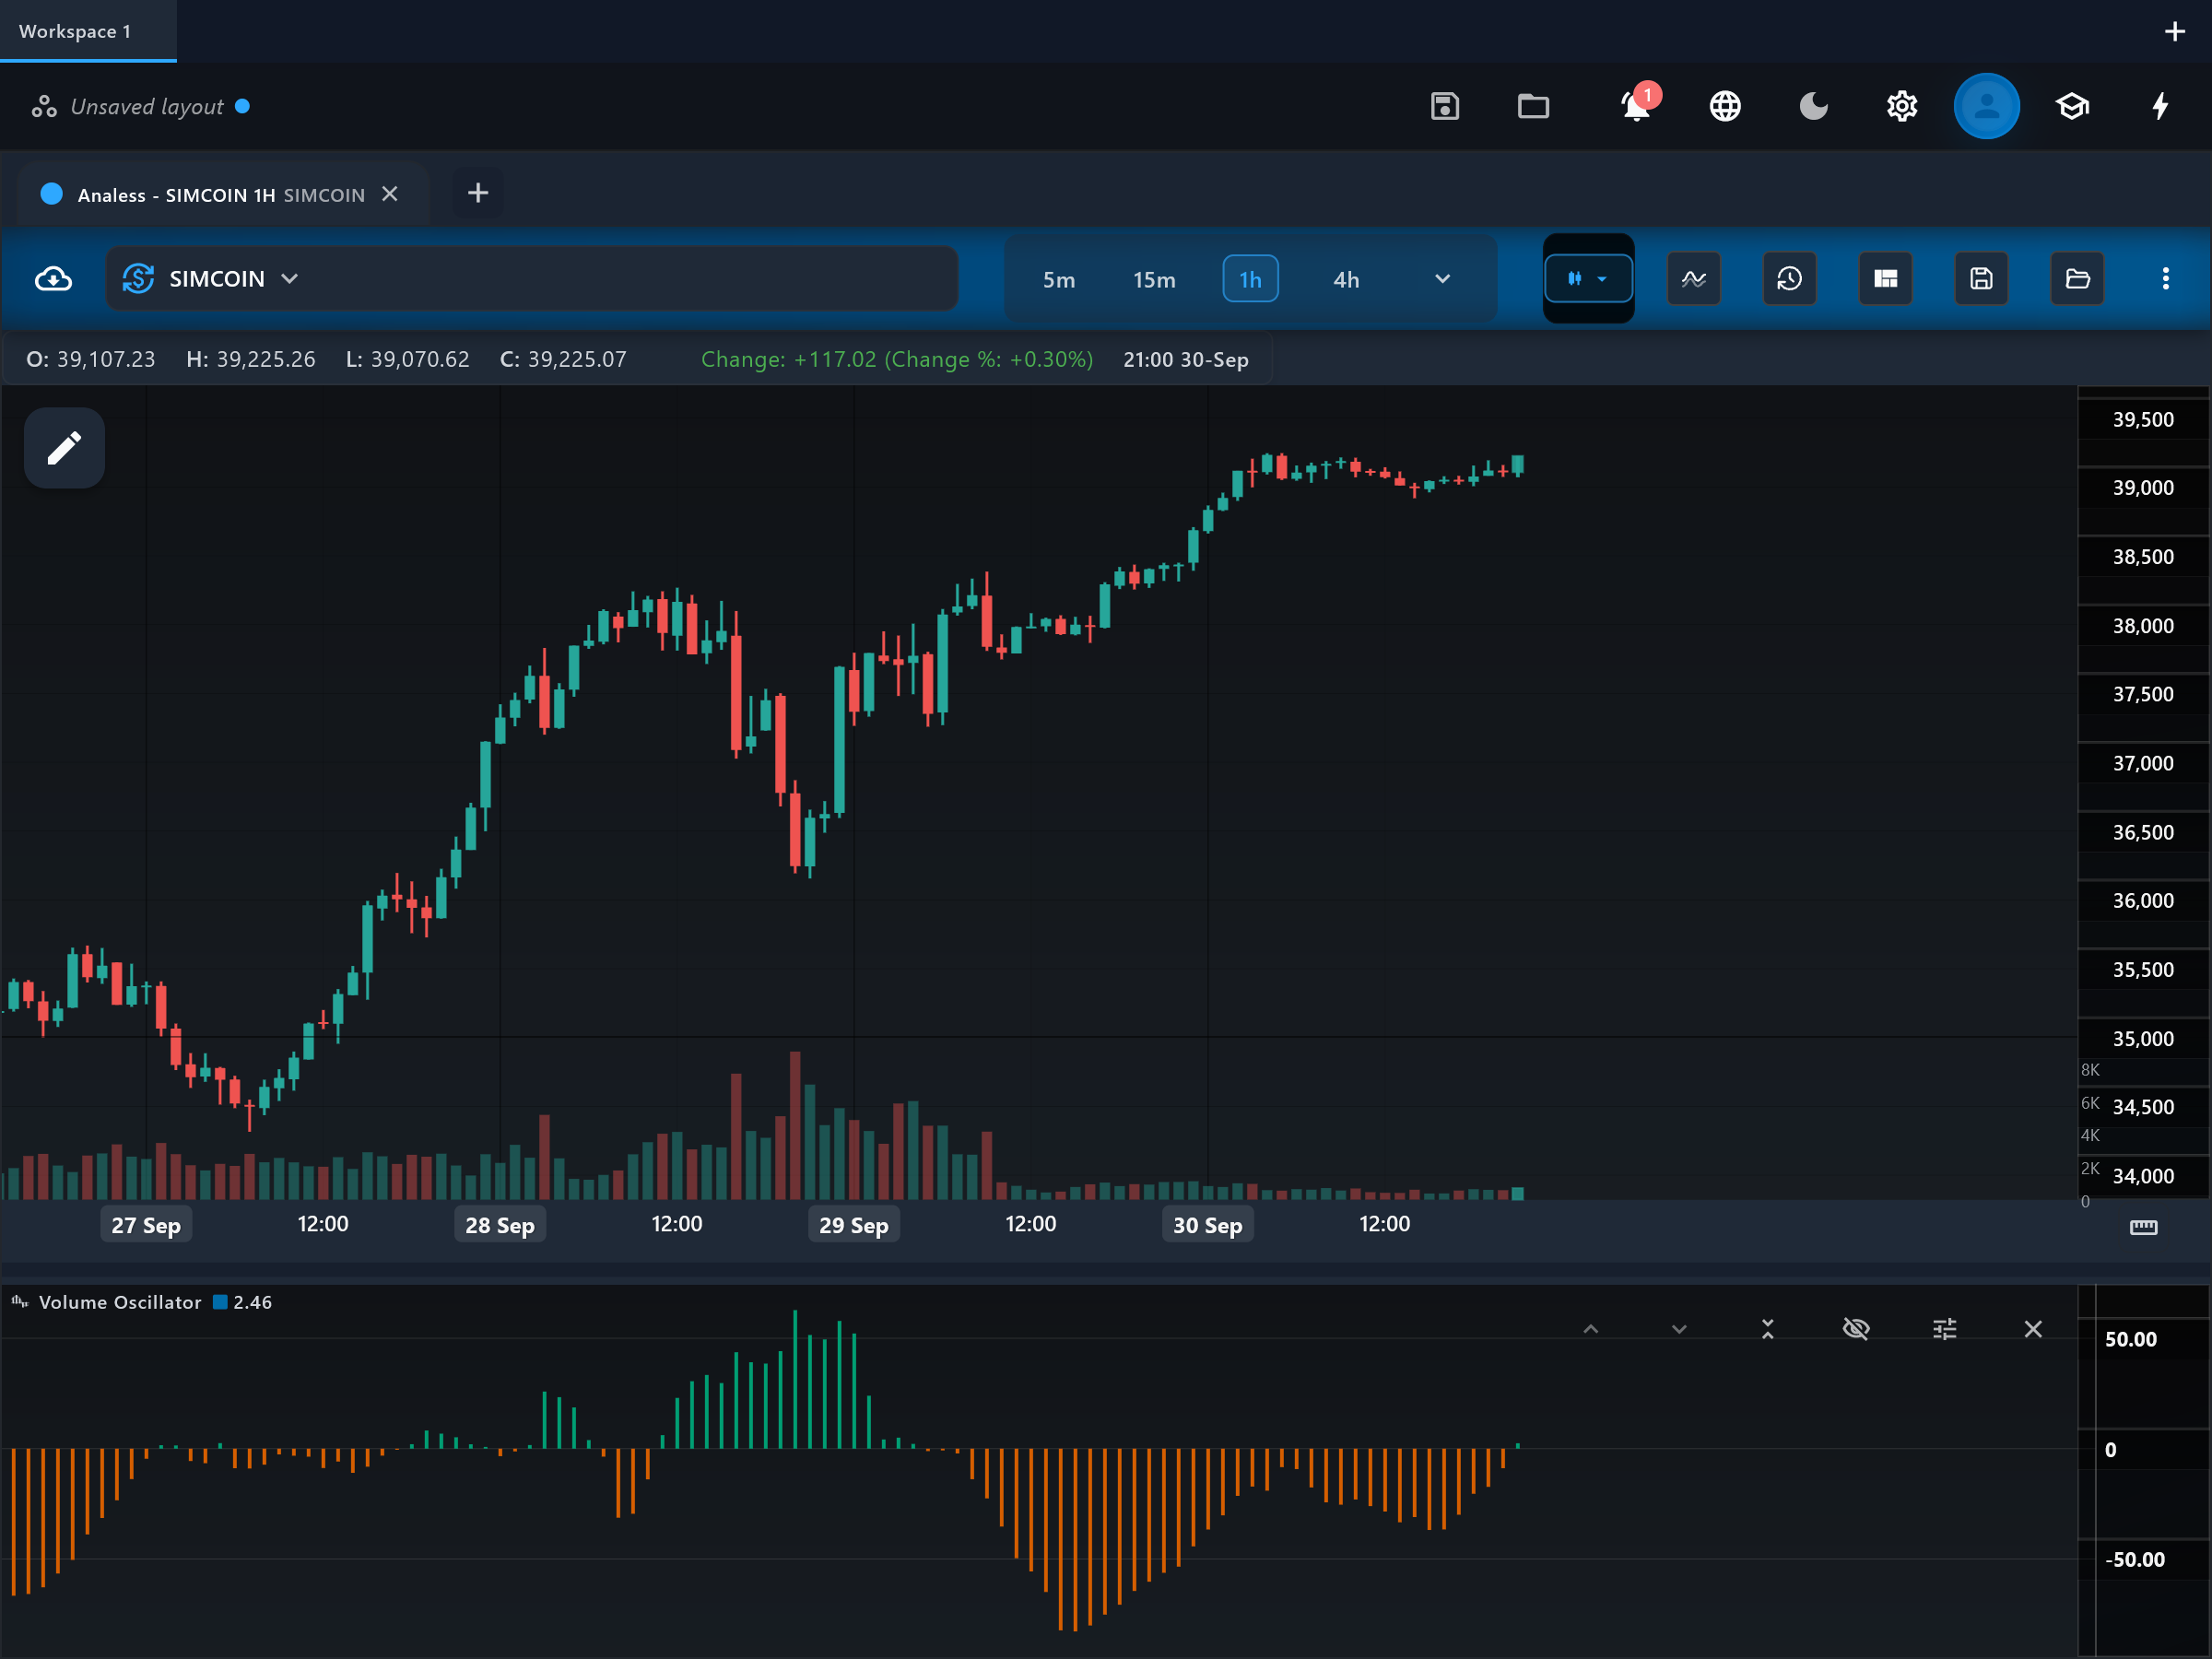
The Volume Oscillator compares a short-term average of volume against a long-term one, expressing the difference as a percentage. It answers a single question: is trading activity currently expanding or contracting relative to its own baseline?
How it is calculated
This app takes a short simple moving average of volume (default 5) and a long one (default 20), subtracts the long from the short, and divides by the long average, scaled to a percentage. The result is drawn as a histogram around zero.
How to read it
The "oscillator" histogram is positive when recent volume runs above its longer baseline — activity is expanding — and negative when activity is contracting. The conventional pairing is with price action: a breakout or trend leg on a rising, positive oscillator has expanding participation behind it, while a price move on a negative oscillator is happening in a thinning market. Deeply negative readings often accompany consolidations and the quiet before a range resolves.
What to look for
- ConfirmationContext
A breakout with the oscillator swinging clearly positive is conventionally read as volume expansion confirming the move.
- Centre-line crossContext
Zero crosses mark short-term volume moving above or below its longer baseline — a regime change in activity, not in price direction.
- DivergenceContext
A trend grinding on while the oscillator sinks below zero is a participation divergence — each new leg is drawing less activity.
When to use it
Applicable to any liquid market and timeframe as a background activity gauge. On thin or illiquid symbols both averages are dominated by a handful of prints, and on spot forex the tick-volume input tracks update frequency rather than money — usable, but interpret loosely.
Works well with
Settings explained
shortPeriod- Length of the short volume average (default 5). Lowering it makes the oscillator react to a single busy session; raising it requires activity to persist before the reading moves.
longPeriod- Length of the long baseline average (default 20). Raising it steadies the baseline so seasonal lulls matter less; it should stay well above the short period for the comparison to mean anything.
Limitations and common mistakes
- It says nothing about price direction — volume can expand equally into rallies and collapses.
- Calendar effects (weekends in crypto, session opens, holidays) drive systematic swings that are not signals.
- The percentage form can look dramatic on low-volume symbols where the baseline itself is tiny.
- Zero crosses are frequent; on their own they carry little information.
References
- Origin: Classical volume construct—no single originator.
This page explains how an indicator is calculated and read. It describes past data, not what price will do next, and it is not a recommendation to trade. Read the disclaimers.
Try it in Analess
Add Volume Oscillator to any chart, adjust its settings, and open this explainer from the indicator itself.