















Indicators · Volume
Volume Rate Of Change
The percent change in volume over a set period.
Origin: Classical volume construct—no single originator
- Best suited to
- Any market condition
- Responsiveness
- Coincident
- Family
- Volume
What it is
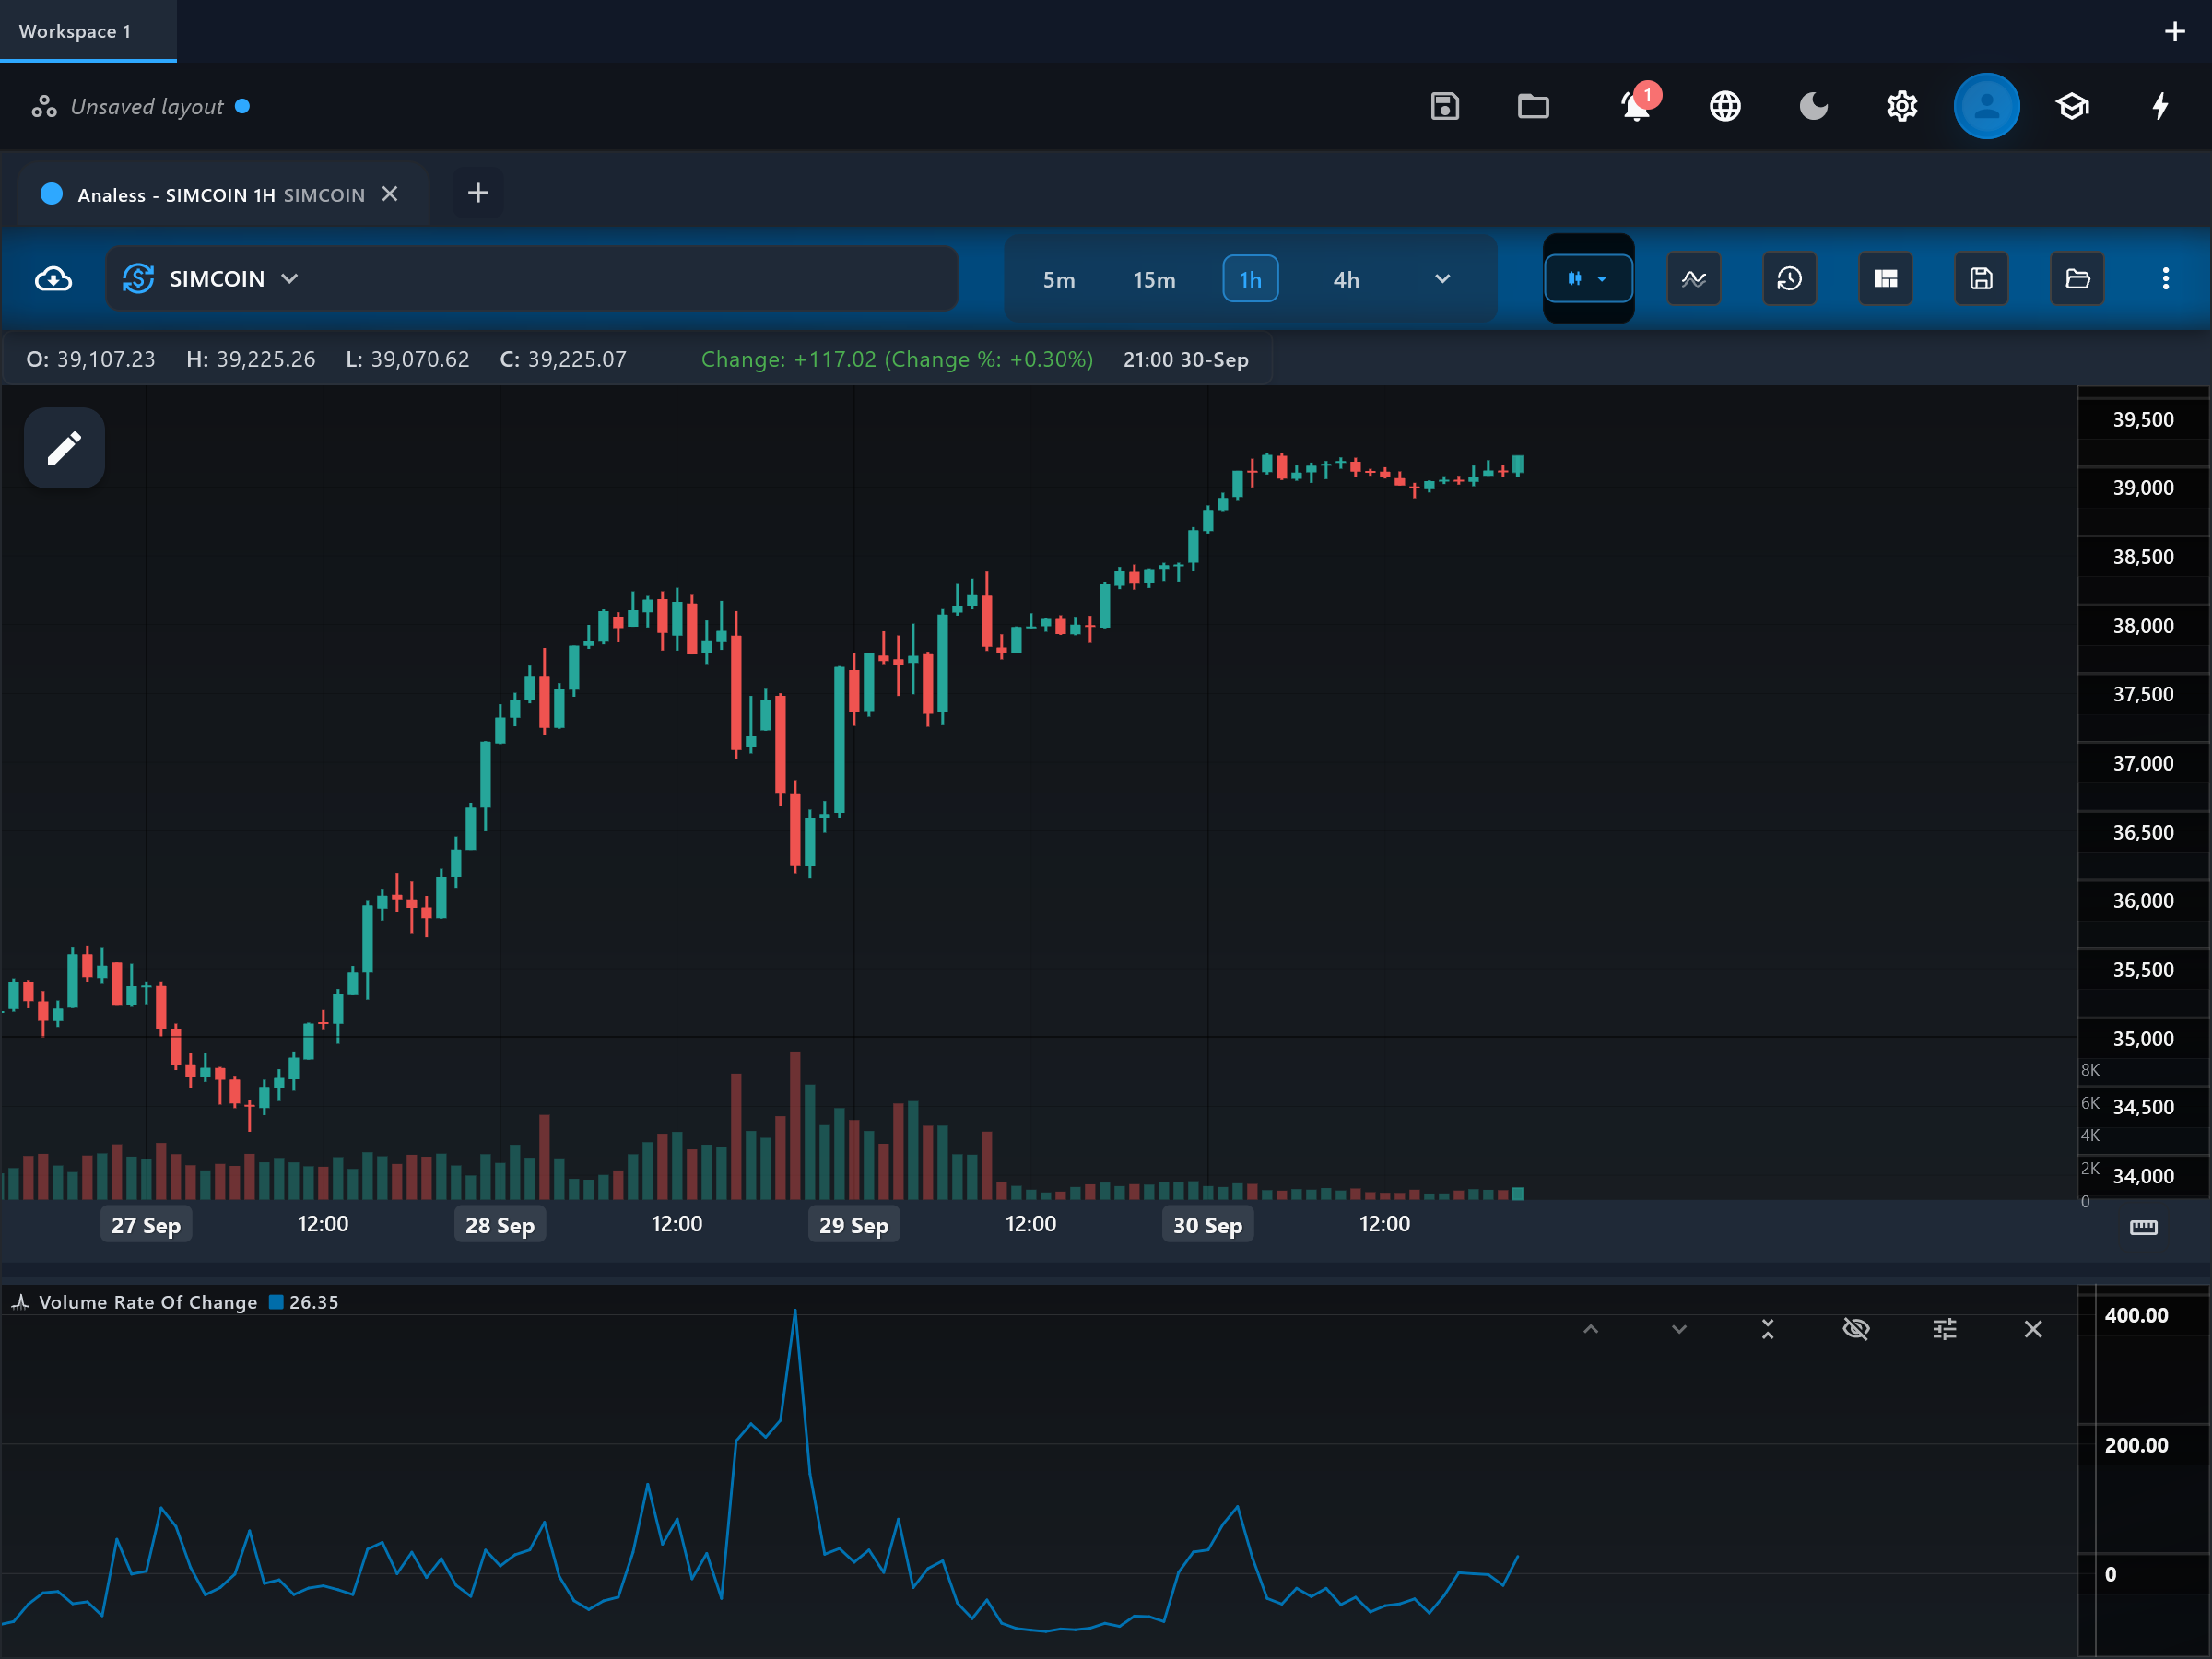
Volume Rate of Change (VROC) measures how much current volume differs from volume a fixed number of bars ago, as a percentage. It highlights sudden surges or droughts in activity — the moments when a market wakes up or goes to sleep.
How it is calculated
This app computes ((volume now - volume N bars ago) / volume N bars ago) x 100, with N set by the period (default 12). No smoothing is applied, so the line is as raw as the volume series itself.
How to read it
The "vroc" line is positive when volume exceeds its level N bars ago and negative when it has fallen. Sharp positive spikes mark activity surges, which often coincide with breakouts, news, or capitulation extremes; long stretches below zero mark drying-up phases typical of consolidations. Because it compares against a single past bar rather than an average, the line is spiky — read clusters and extremes, not individual wiggles.
What to look for
- ConfirmationContext
A price breakout accompanied by a strong positive vroc spike shows the move is drawing a genuine surge of participation.
- Range expansionContext
An extreme vroc spike after a long trend can accompany a climax — a burst of activity as the move exhausts — and is read through the surrounding price action.
- DivergenceContext
Price pushing to new extremes while vroc stays flat or negative shows the move is failing to attract fresh activity.
When to use it
Works anywhere volume is meaningful — stocks, futures, liquid crypto — and on any timeframe, as an event detector rather than a standing signal. Thin symbols make it useless (a single print produces a huge percentage swing), and on spot forex it measures changes in tick count, not money.
Works well with
Settings explained
period- How many bars back the comparison volume is taken from (default 12). Short periods catch sudden one-session surges; longer periods compare against a different market phase and behave more like a slow activity trend.
Limitations and common mistakes
- Comparing against a single past bar makes the line very spiky; one quiet reference bar can produce a huge spurious spike.
- It is symmetric in ignorance: it flags activity changes without any directional information.
- Percentage changes explode when the reference volume is near zero.
- Calendar rhythms (weekly cycles, session opens) create repeating spikes that are structure, not signal.
References
- Origin: Classical volume construct—no single originator.
This page explains how an indicator is calculated and read. It describes past data, not what price will do next, and it is not a recommendation to trade. Read the disclaimers.
Try it in Analess
Add Volume Rate Of Change to any chart, adjust its settings, and open this explainer from the indicator itself.