















Indicators · Moving averages
VWMA
Volume-Weighted Moving Average — an average that weights each price by its volume.
Origin: Classical construct—no single originator
- Best suited to
- Trending markets
- Responsiveness
- Lagging
- Family
- Moving averages
What it is
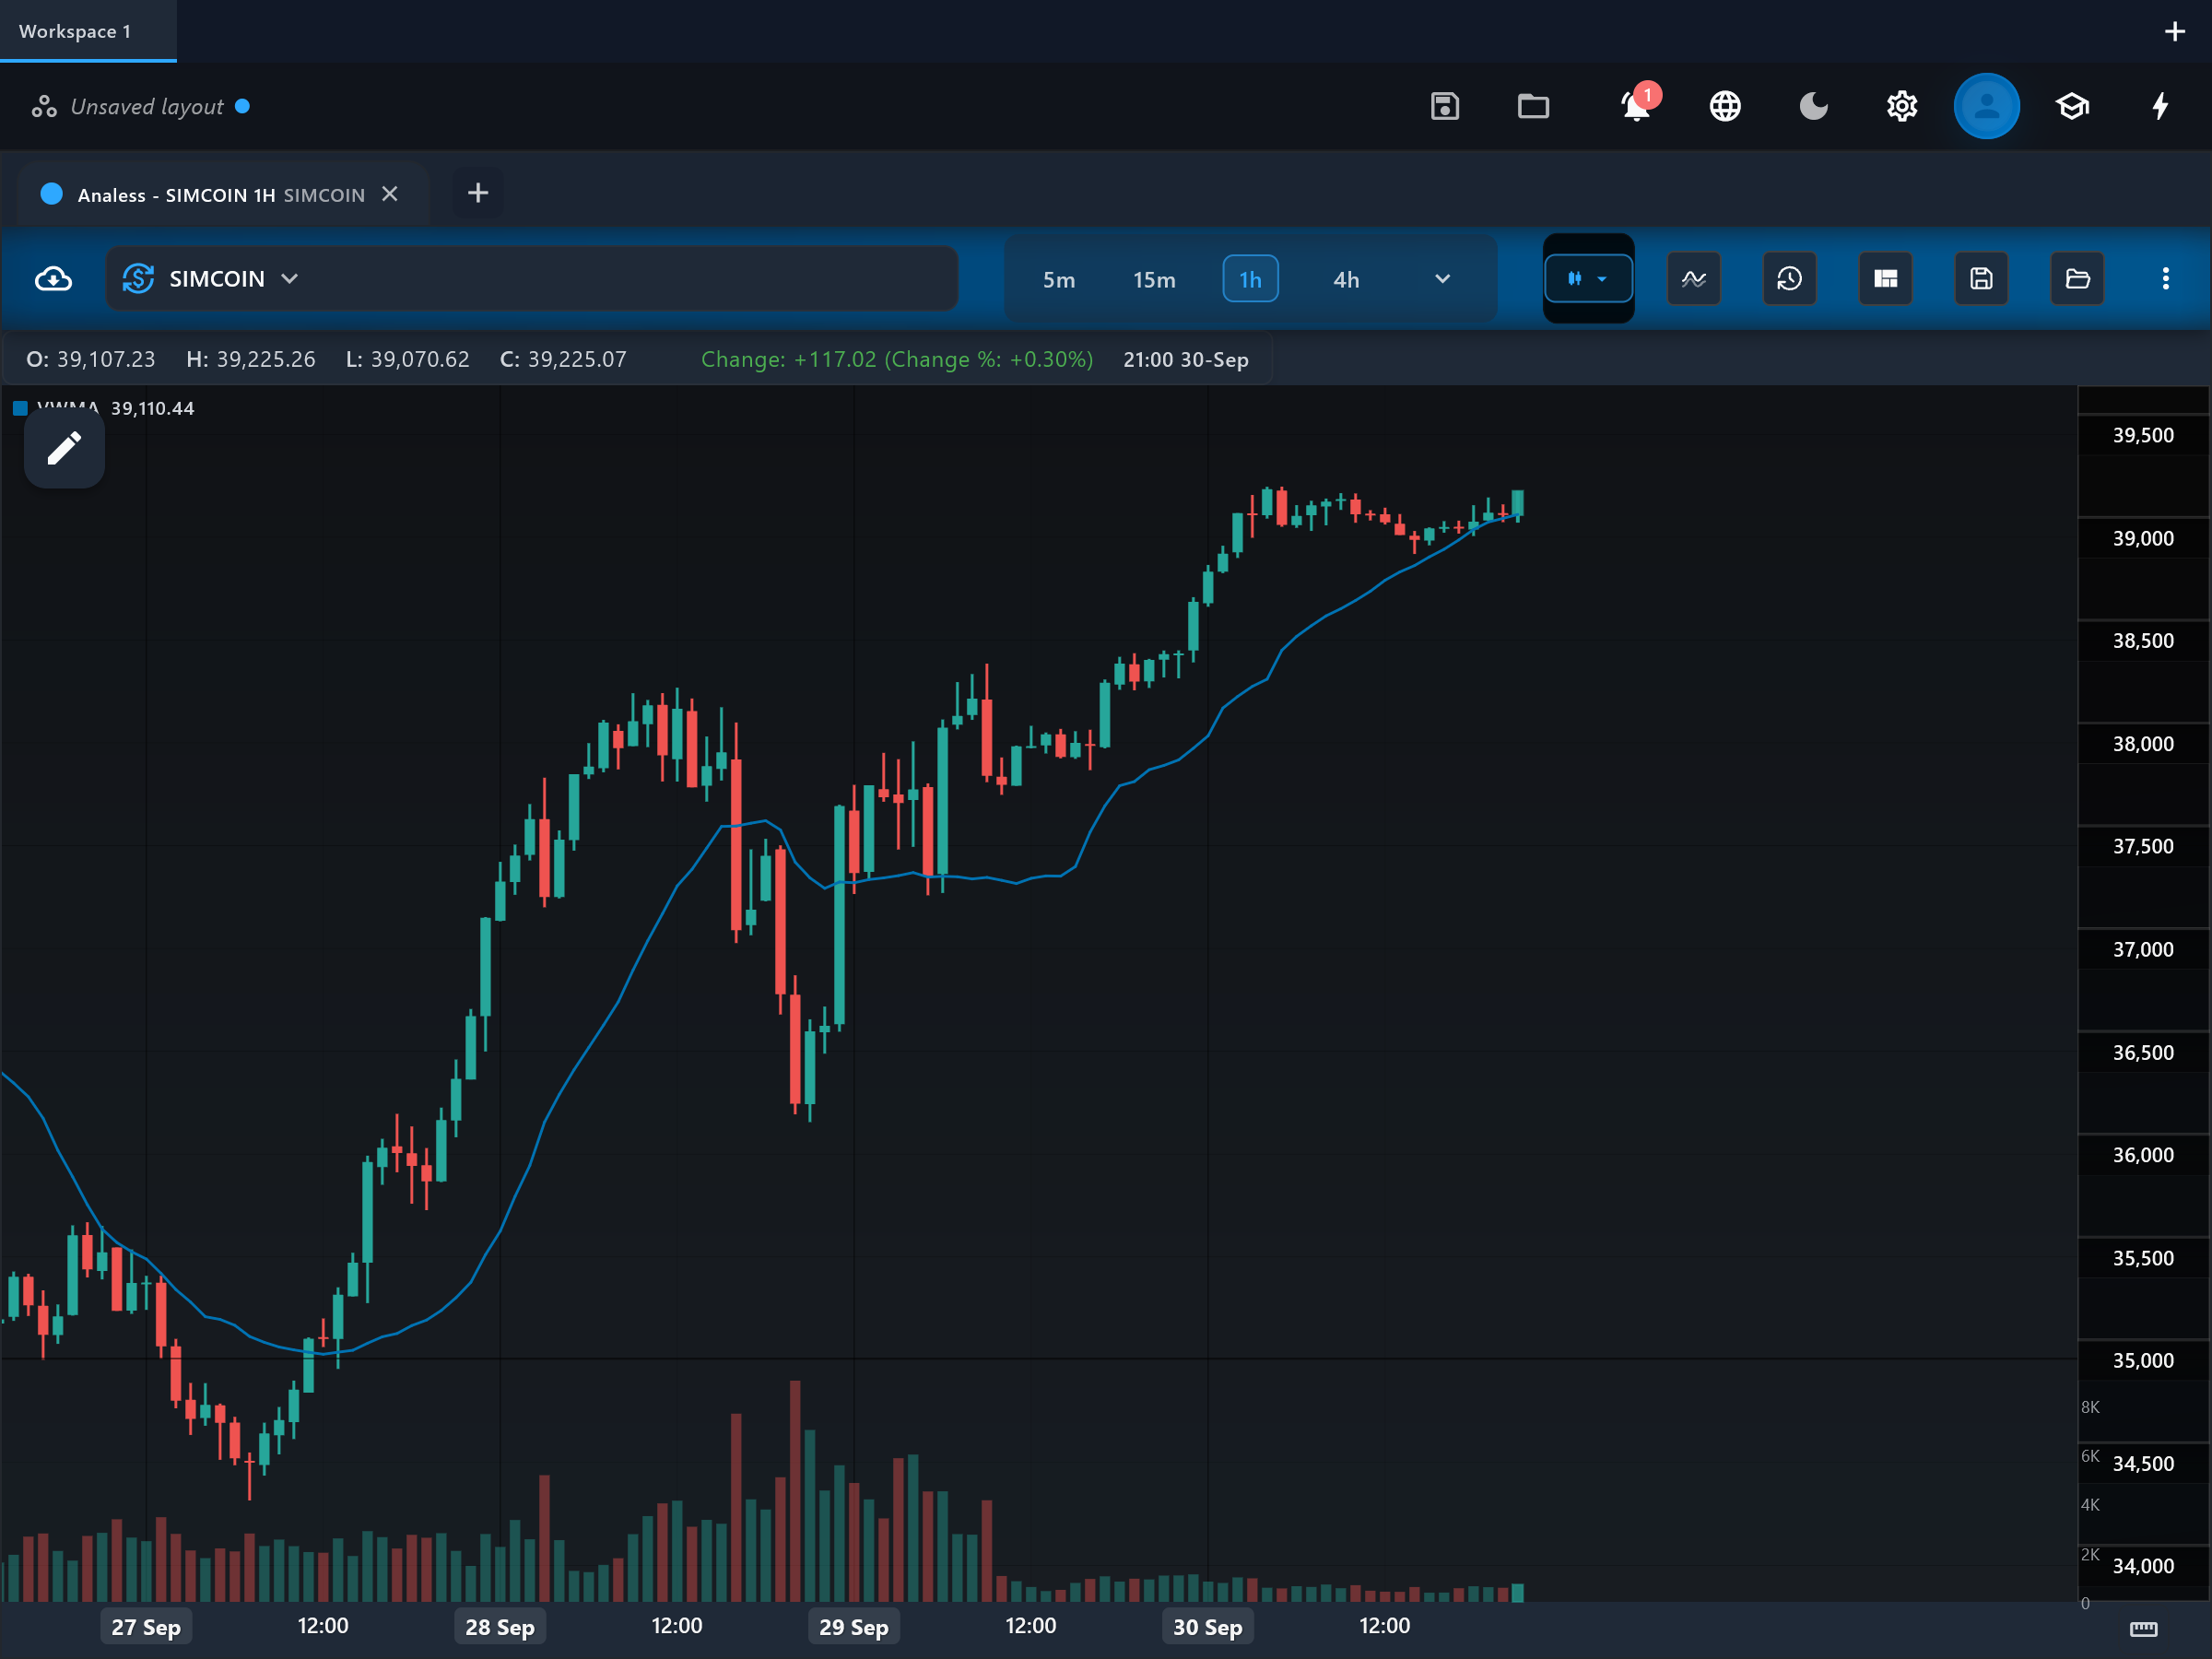
The Volume Weighted Moving Average (VWMA) is a moving average in which each bar counts in proportion to its traded volume. Bars where a lot of business was done pull the average toward their price, so the line reflects where volume actually traded rather than treating every bar equally.
How it is calculated
Over the lookback window, each closing price is multiplied by that bar volume, the products are summed, and the total is divided by the sum of volume: VWMA = sum(close x volume) / sum(volume). When volume is uniform the VWMA equals the SMA; when volume spikes on particular bars, those bars dominate the average. In this app the VWMA is always computed from the closing price.
How to read it
The indicator draws one line, vwma, on the price chart, and it is most informative when compared with a same-length SMA. VWMA above the SMA means recent volume concentrated on up bars — buying conviction; VWMA below the SMA means volume favored down bars. When the two lines track together, volume is not taking sides. On its own, the vwma line is read like any moving average: slope for trend, and the line as volume-backed support or resistance.
What to look for
- Price crossUpside
Price closes above the vwma line — a cross above a volume-weighted average implies the move has cleared the level where most recent volume traded.
- Price crossDownside
Price closes below the vwma line — sellers have pushed price beneath the volume-weighted consensus.
- ConfirmationContext
VWMA pulling away from a same-length SMA in the direction of the trend confirms that volume backs the move; VWMA lagging behind the SMA warns the move is thin.
- Trend filterContext
The slope of the vwma line filters trades toward the side where volume-weighted price is heading.
When to use it
VWMA needs trustworthy volume, so it is best on centralized markets: stocks, futures and crypto exchange feeds, from intraday to daily timeframes. It is unreliable on spot forex and CFDs, where reported volume is only the broker tick count rather than true traded size. In thin, illiquid instruments a single block trade can distort the line.
Works well with
Settings explained
period- Default 20. Raising it averages volume influence over a longer window, smoothing the line and muting individual volume spikes; lowering it lets recent high-volume bars dominate and the line react faster.
Limitations and common mistakes
- It is only as good as the volume feed — synthetic or broker-specific volume (spot forex, CFDs) undermines it.
- A single abnormal volume spike (index rebalance, block trade, liquidation cascade) can pin the average to one price for the whole window.
- It still lags like any moving average of the same length.
References
- Origin: Classical construct—no single originator.
- Moving average — Wikipedia (opens in a new tab)
This page explains how an indicator is calculated and read. It describes past data, not what price will do next, and it is not a recommendation to trade. Read the disclaimers.
Try it in Analess
Add VWMA to any chart, adjust its settings, and open this explainer from the indicator itself.