















Indicators · Momentum & oscillators
Williams %R
Shows where price sits in its recent range, inverted, on a 0 to -100 scale.
Origin: Larry Williams, 1973
- Best suited to
- Ranging markets
- Responsiveness
- Leading
- Family
- Momentum & oscillators
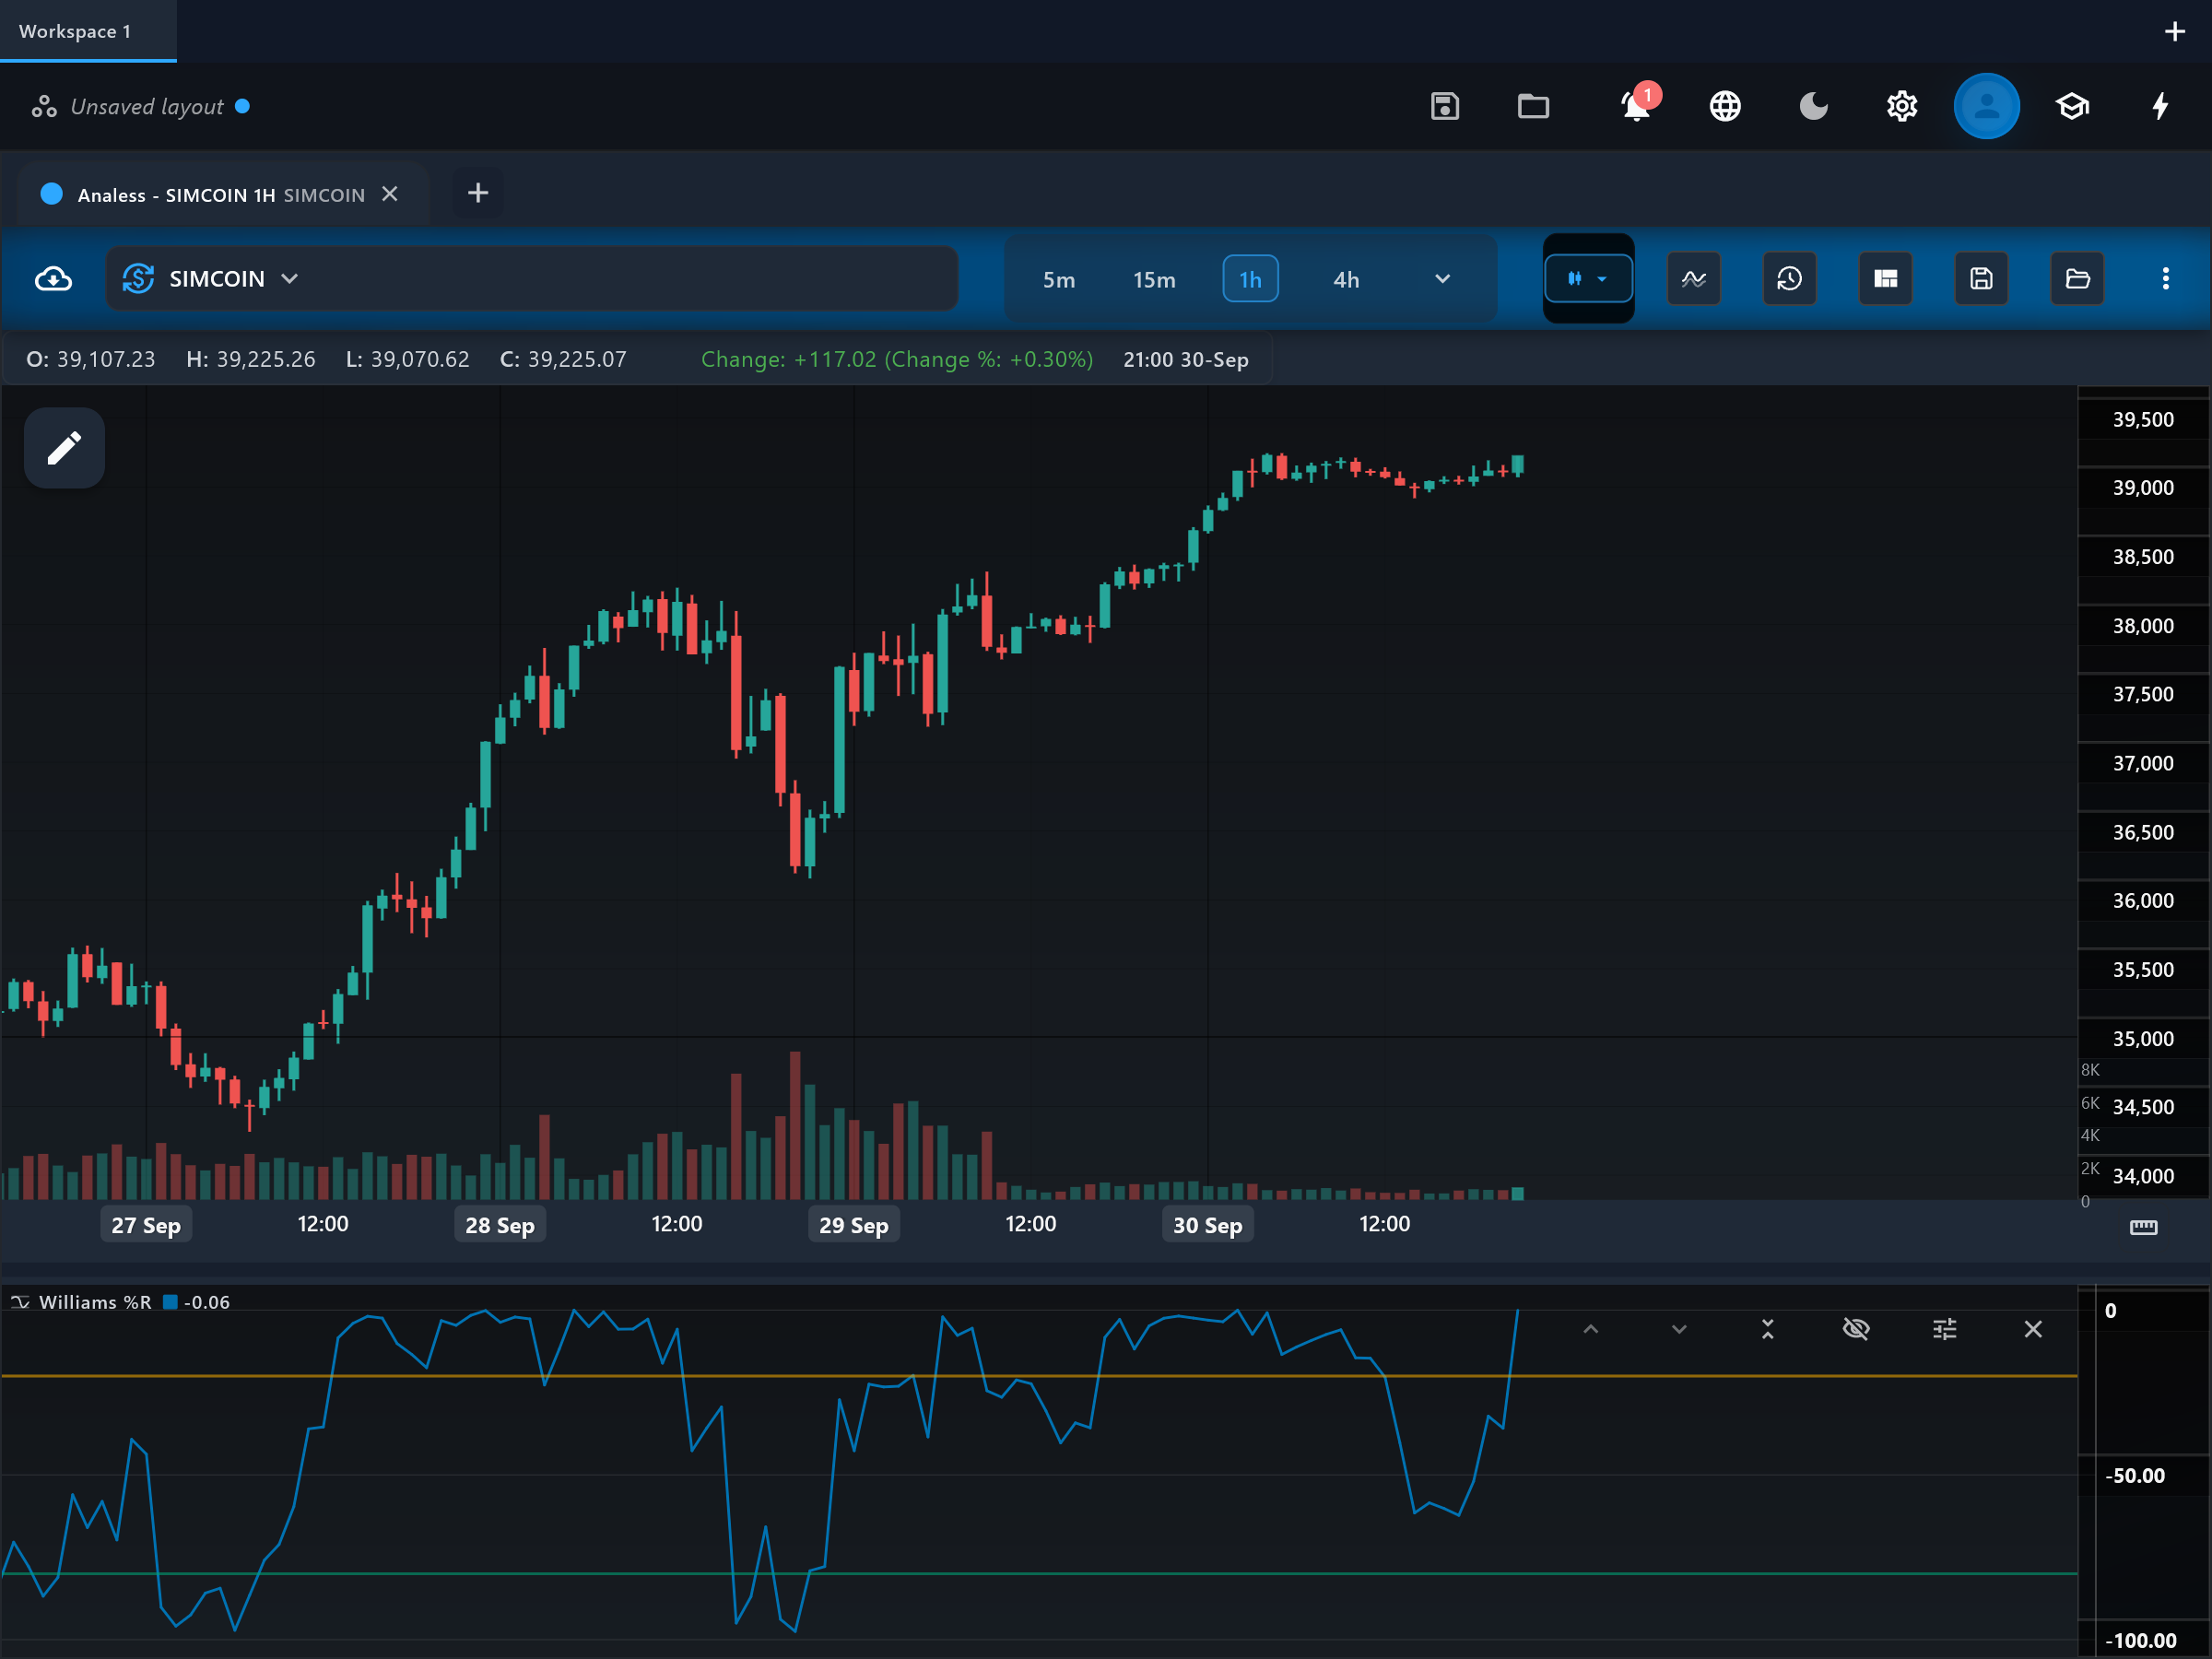
What it is
Williams %R shows where the current close sits relative to the highest high of the lookback window, on a scale from 0 (at the high) down to -100 (at the low). It is the mirror image of the raw stochastic %K: the same range-position idea, measured from the top instead of the bottom.
How it is calculated
%R = -100 x (highest high - close) / (highest high - lowest low) over the lookback period. A close at the very top of the window gives 0; at the very bottom, -100. There is no smoothing step in this indicator — it is the raw range position, bar by bar.
How to read it
The pane shows the "williams_r" line between the "overbought" (default -20) and "oversold" (default -80) guide lines — note the negative scale, where values near 0 are the strong side. Above -20 the close is within the top 20 percent of the recent range; below -80, within the bottom 20 percent. Because it is unsmoothed, the line is jagged and reacts instantly to each bar. Many traders watch for %R to exit a zone rather than enter it.
What to look for
- Overbought / oversoldContext
Above -20 the close is pressing the top of the recent range; below -80 the bottom. In trends, staying pinned in a zone is persistence, not an automatic reversal.
- Overbought / oversoldUpside
A climb back above -80 after a stay in the oversold zone suggests closes are lifting off the range lows.
- Overbought / oversoldDownside
A drop back below -20 after a stay in the overbought zone suggests closes are slipping from the range highs.
- DivergenceContext
Price making a new extreme while %R does not (it stays short of 0 or -100) hints the range position is weakening.
When to use it
Williams %R suits range-bound markets and short-term timing on any liquid instrument, where the -20/-80 zones map to real range edges. As a bounded oscillator it misleads in strong trends — a healthy uptrend keeps %R near 0 for long stretches, and treating that as "overbought" gets you out early or short into strength. Its lack of smoothing also makes it noisier than the stochastic on fast timeframes.
Works well with
Settings explained
period- Default 14 — the high/low lookback window. Shorter windows (7-10) hit the zones constantly; longer ones (21+) reserve them for larger swings.
overboughtLevel- Default -20 — the upper guide level drawn on the pane. Tighten it (e.g. -25) for choppier markets, loosen it (e.g. -10) for strong trends.
oversoldLevel- Default -80 — the lower guide level drawn on the pane. Tighten it (e.g. -75) for choppier markets, loosen it (e.g. -90) for strong downtrends.
Limitations and common mistakes
- No smoothing: the line is jagged and single-bar spikes can flip a zone reading.
- Stays pinned near 0 or -100 throughout strong trends, making zone readings meaningless there.
- Carries the same information as raw stochastic %K — using both adds no new signal.
References
- Origin: Larry Williams, 1973.
- Williams %R — Wikipedia (opens in a new tab)
This page explains how an indicator is calculated and read. It describes past data, not what price will do next, and it is not a recommendation to trade. Read the disclaimers.
Try it in Analess
Add Williams %R to any chart, adjust its settings, and open this explainer from the indicator itself.