















Indicators · Moving averages
Zero Lag EMA
An EMA that subtracts its own lag to react faster to price changes.
Origin: John Ehlers and Ric Way, 2010
- Best suited to
- Trending markets
- Responsiveness
- Lagging
- Family
- Moving averages
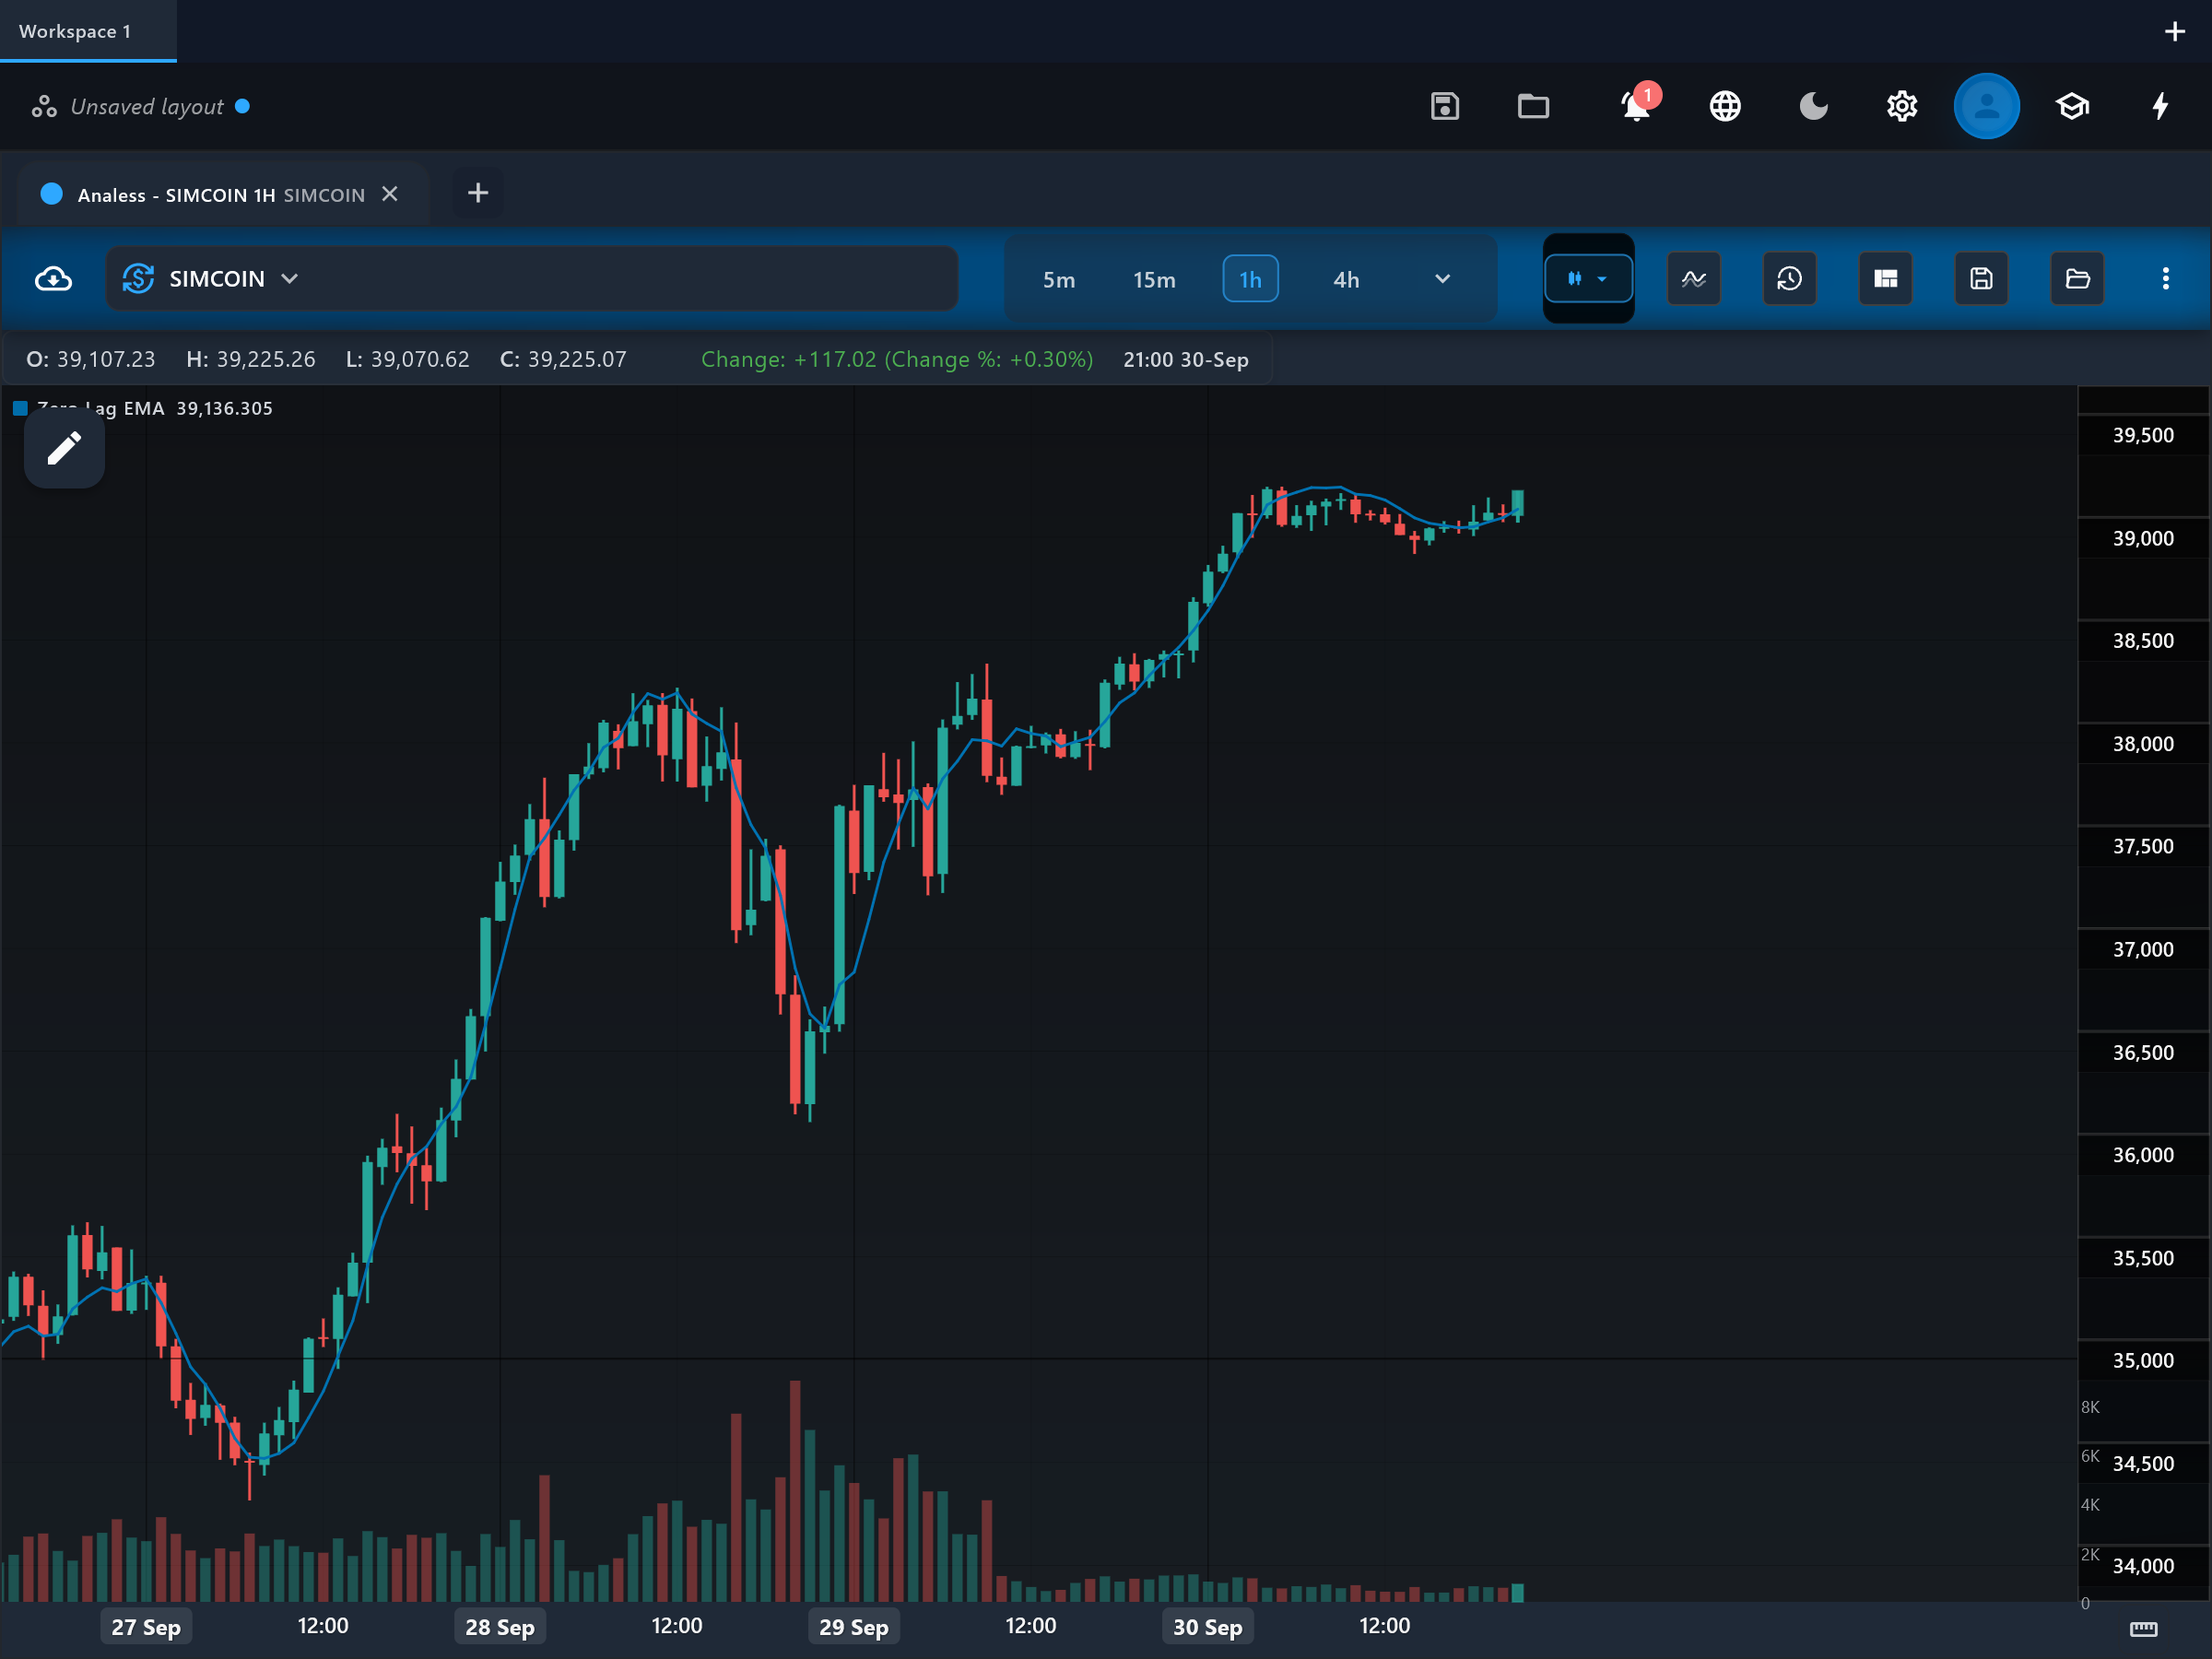
What it is
The Zero Lag EMA (ZLEMA) is an exponential moving average with an error-correcting step that removes most of the delay inherent in smoothing. It tracks price nearly in step while still filtering bar-to-bar noise, making it one of the fastest trend lines available.
How it is calculated
Before smoothing, the indicator de-lags the input: it takes the current price, doubles it, and subtracts the price from lag bars ago, where lag = floor((period - 1) / 2 x lagFactor). That momentum-boosted series (2 x price - price[lag]) is then run through a standard EMA of the chosen period. The subtraction adds back an estimate of what smoothing removes, cancelling most of the delay. Setting enableZeroLag to false skips the de-lag step and plots a plain EMA.
How to read it
The indicator draws one line, zlema_line, on the price chart. It rides much closer to price than a regular EMA of the same length, so its turns arrive earlier and price crossings are prompt. Read its slope as the immediate trend, and expect it to overshoot slightly at sharp reversals — the de-lagging term extrapolates momentum, so a violent turn can briefly bend the line past price. A tight braid of price and zlema_line signals a directionless market.
What to look for
- Price crossUpside
Price closes above zlema_line — because the line carries little lag, this fires close to the actual turn.
- Price crossDownside
Price closes below zlema_line — the early bearish counterpart.
- Signal-line crossContext
A fast ZLEMA crossing a slower conventional EMA gives crossover signals several bars earlier than a same-length EMA pair — with proportionally more false starts.
- Trend filterContext
The slope of zlema_line is a near-real-time trend filter; combine it with a slower average to grade signal quality.
When to use it
ZLEMA appeals to short-term traders in fast markets — crypto, index futures and major forex pairs on minute-to-hourly charts — where ordinary EMA lag costs real money. It also works as the fast leg of crossover systems on any timeframe. Avoid leaning on it in quiet ranges: near-zero lag means near-zero filtering of directionless noise.
Works well with
Settings explained
period- Default 14. The EMA length applied after de-lagging. Raising it smooths the line and steadies its turns; lowering it makes an already fast line hyper-reactive.
lagFactor- Default 1.0 (full de-lag, lag = floor((period - 1) / 2)). Lowering it toward 0 applies only partial lag correction, moving the line back toward plain-EMA behavior; values above 1 over-correct and increase overshoot.
enableZeroLag- Default on. Turning it off disables the de-lag step entirely so the plot becomes a standard EMA of the chosen period — useful for comparing the two behaviors side by side.
source- Default close. The de-lag and EMA are applied to this price field; close is standard.
Limitations and common mistakes
- The de-lagging term extrapolates momentum, so the line overshoots at sharp reversals and can whip around fast turns.
- Less lag means less smoothing: in choppy markets it crosses price constantly and generates noise trades.
- It cannot truly achieve zero lag — it estimates and subtracts lag, and the estimate is wrong exactly when the market changes character.
References
- Origin: John Ehlers and Ric Way, 2010.
- Zero lag exponential moving average — Wikipedia (opens in a new tab)
This page explains how an indicator is calculated and read. It describes past data, not what price will do next, and it is not a recommendation to trade. Read the disclaimers.
Try it in Analess
Add Zero Lag EMA to any chart, adjust its settings, and open this explainer from the indicator itself.